4Keys
The keys in this Section can be given as ⟨options⟩ to the command \wheelchart.
If applicable, an optional non-empty ⟨range⟩ between braces can be given to a key after the ⟨key name⟩ except for the key slice where the ⟨range⟩ is mandatory. This ⟨range⟩ is processed with \foreach with the option parse=true. Hereafter the elements are processed with \fp_eval:n. If such a ⟨range⟩ is given to a key then the options given to this key will only be applied to a slice if the number of the slice is in the ⟨range⟩. The ⟨range⟩ only makes sense for a key which is processed for each slice. For example, the ⟨range⟩ does not make sense for the key middle.
Furthermore, it is possible to add {list} after the ⟨key name⟩. Then a list can be given to the key. This list is processed analogously as how the key WClist⟨name⟩ works. Then the result is given to the key.
Below are some examples for the options ⟨range⟩ and {list}.
-
• The following wheelchart can be obtained with the 3 possibilities below.
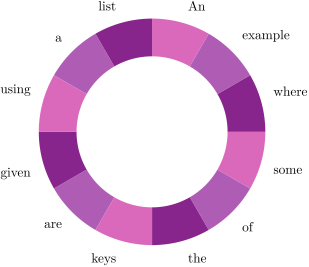
\begin{tikzpicture}

           \wheelchart[

  data{list}={

    An,example,where,some,of,the,

    keys,are,given,using,a,list

  },

  slices style{list}={

    Thistle,Orchid,Fuchsia


  },

             total count=12

]{}

\end{tikzpicture}
\usepackage {listofitems}

\readlist\WCcolors{Thistle,Orchid,Fuchsia}


\setsepchar{ }

\readlist\WCdata{An example where some of the keys are given using a list}


data=\WCdata[        \WCcount],


      slices style={

  /utils/exec=\pgfmathsetmacro{\WCcolornumber}{int(Mod(\WCcount-1,\WCcolorslen)+1)},

  \WCcolors[\WCcolornumber]

},


total count=\WCdatalen,
-
• The following wheelchart can be obtained with the 3 possibilities below.
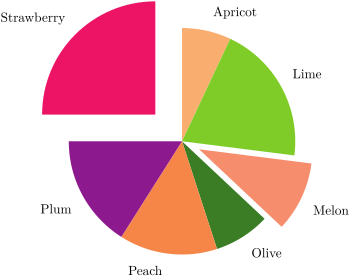
\begin{tikzpicture}

           \wheelchart[

         explode=\WCvarF,

     pie


]{                     \exampleforthismanual}

\end{tikzpicture}
explode={ \WCcount==3?0.5:(\WCcount==7?1:0)},
-
/wheelchart/after slices={⟨code⟩} (no default, initially empty) 
The ⟨code⟩ given to this key will be executed after each slice of the wheelchart.
-
/wheelchart/anchor xsep={⟨angle⟩} (no default, initially 5) 
-
/wheelchart/anchor ysep={⟨angle⟩} (no default, initially 5) 
These keys determine the default anchor of the key data in the case that lines ext=0. Note that rounding errors can occur in the computation of the angle which is used to determine the default anchor according to Table 1.
| Anchor of the key data | |
| Angle (up to rounding errors) | in the case that lines ext=0 |
| \(0\) | west |
| \(90\) | south |
| \(180\) | east |
| \(270\) | north |
| For other angles not in \(\{0,90,180,270\}\): | |
| \([0,\text {|anchor ysep|}]\) | west |
| \(\ointerval {\text {|anchor ysep|}}{90-\text {|anchor xsep|}}\) | south west |
| \([90-\text {|anchor xsep|},90+\text {|anchor xsep|}]\) | south |
| \(\ointerval {90+\text {|anchor xsep|}}{180-\text {|anchor ysep|}}\) | south east |
| \([180-\text {|anchor ysep|},180+\text {|anchor ysep|}]\) | east |
| \(\ointerval {180+\text {|anchor ysep|}}{270-\text {|anchor xsep|}}\) | north east |
| \([270-\text {|anchor xsep|},270+\text {|anchor xsep|}]\) | north |
| \(\ointerval {270+\text {|anchor xsep|}}{360-\text {|anchor ysep|}}\) | north west |
| \([360-\text {|anchor ysep|},360]\) | west |
Table 1: Anchor of the key data in the case that lines ext=0.
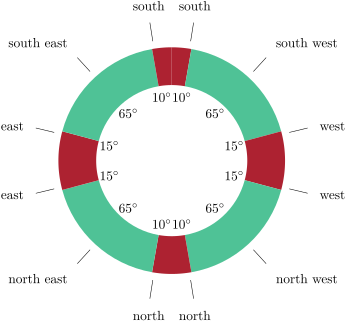
\usepackage {siunitx}

\begin{tikzpicture}

             \wheelchart[

              anchor xsep=10,

              anchor ysep=15,

       data=        \WCvarA,

                 data angle pos=\WClistdap,

             inner data=\ang{\WClistvalue},

                        inner data angle pos=\WClistdap,

                 inner data sep=0.3,

        lines=0.5,

                  lines angle pos=\WClistdap,

  slices style{list}={

    Maroon,SeaGreen,Maroon


  },

        value=\WClistvalue,

  WClistdap={0.9,0.5,0.1},

  WClistvalue={10,65,15,15,65,10}

]{

  south,

  south west,

  west,

  west,

  north west,

  north,

  north,

  north east,

  east,

  east,

  south east,

  south

}

\end{tikzpicture}
The anchor of the data can also be specified manually by setting the ⟨position⟩ in the key data style.
-
/wheelchart/arc={⟨options⟩} (style, no default, initially empty) 
If this key is set then an arc with the style determined by this key will be drawn following the arc or plot for a slice of the wheelchart.
-
/wheelchart/arc around line={⟨number⟩} (no default, initially 1) 
The contents of the key arc data can consist of multiple lines separated by \\. If the key arc around text is true then the corresponding line is determined by ⟨number⟩.
-
/wheelchart/arc around text=⟨boolean⟩ (default true, initially false) 
If true then the arc with the style determined by the key arc will be split in two parts such that the gap between these two parts leaves space for the contents of line ⟨number⟩ of the key arc data where ⟨number⟩ is determined by the key arc around line. The space between the arc and the contents of the key arc data can be increased with for example ~ in arc data=~text~.
-
/wheelchart/arc data={⟨text⟩} (no default, initially empty) 
This key contains the ⟨text⟩ which will be placed following the arc or plot for a slice of the wheelchart using the decoration text along path. This requires the TikZ library decorations.text. The style of this decoration is given as follows. First, the option raise=-0.5ex is given. Then text align is determined by the key arc data align. Thereafter, the style of the key arc data style is added.
The ⟨text⟩ can consist of multiple lines separated by \\.
Braces or multiple pairs of braces are required around some macros.
-
/wheelchart/arc data align=center|left|right (no default, initially center) 
This key determines the alignment of the contents of the key arc data.
-
/wheelchart/arc data angle pos={⟨value⟩} (no default, initially 0.5) 
-
/wheelchart/arc data angle shift={⟨angle⟩} (no default, initially 0) 
These keys determine the position of the contents of the key arc data similar as the corresponding keys for the key data.
-
/wheelchart/arc data dir={⟨value⟩} (no default, initially 1) 
This key determines the direction of the contents of the key arc data. If the ⟨value⟩ is positive then the direction is the same as the direction of the slice. If the ⟨value⟩ is negative then the direction is reversed. The values 1 and -1 are recommended.
When the contents of the key arc data is placed, the corresponding domain for the arc or plot is estimated. A warning is given when the contents of the key arc data did (possibly) not fit. In this case, the absolute value of the key arc data dir should be increased.
If an error Dimension too large occurs then the absolute value of the key arc data dir should be increased or decreased depending on the situation.
-
/wheelchart/arc data expand={⟨expansion type⟩} (no default, initially n) 
The contents of the key arc data can consist of multiple lines separated by \\. This splitting is done with \seq_set_split:Nnn or a variant thereof depending on the ⟨expansion type⟩ which determines the last letter in the signature. For most use cases, this ⟨expansion type⟩ is n, e or f.
In the example below, it is necessary to use arc data expand=e and to place \noexpand before \bfseries.
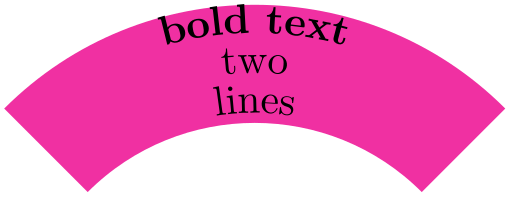
\usetikzlibrary {decorations.text}

\begin{tikzpicture}

            \wheelchart[

          arc data=|\noexpand\bfseries|        \WCvarC\\

    \WCvarD,

                  arc data expand=e,

               arc data pos=0.5,

      data=,

             start angle=135,

             total angle=90

]{1/VioletRed/bold text/two\\lines}

\end{tikzpicture}
-
/wheelchart/arc data line sep factor={⟨factor⟩} (no default, initially 1) 
The contents of the key arc data can consist of multiple lines separated by \\. The ⟨factor⟩ determines the spacing between these lines.
-
/wheelchart/arc data lines pos={⟨factor⟩} (no default, initially 0.5) 
-
/wheelchart/arc data lines shift={⟨value⟩} (no default, initially 0) 
The positioning of the lines of the key arc data is determined by the index \(k-1-\text {|arc data lines pos|}\cdot (N-1)+\text {|arc data lines shift|}\) where \(N\) is the number of lines and \(k\in \{1,\dots ,N\}\).
-
/wheelchart/arc data pos={⟨value⟩} (no default, initially 1) 
-
/wheelchart/arc data sep={⟨value⟩} (no default, initially 1ex/1cm) 
These keys determine the position of the contents of the key arc data similar as the corresponding keys for the key data.
-
/wheelchart/arc data style={⟨options⟩} (style, no default, initially empty) 
This key accepts a list of keys which will be applied to the decoration for the key arc data.
-
/wheelchart/arc first half={⟨options⟩} (style, no default, initially empty) 
If arc around text is true then the arc with the style determined by the key arc will be split in two parts. The style determined by the key arc first half will be appended to the first half of the arc.
-
/wheelchart/arc pos={⟨value⟩} (no default, initially 1) 
This key determines the position of the arc similar as the corresponding key for the key data.
-
/wheelchart/arc second half={⟨options⟩} (style, no default, initially empty) 
This key is similar to the key arc first half but will be appended to the second half of the arc.
-
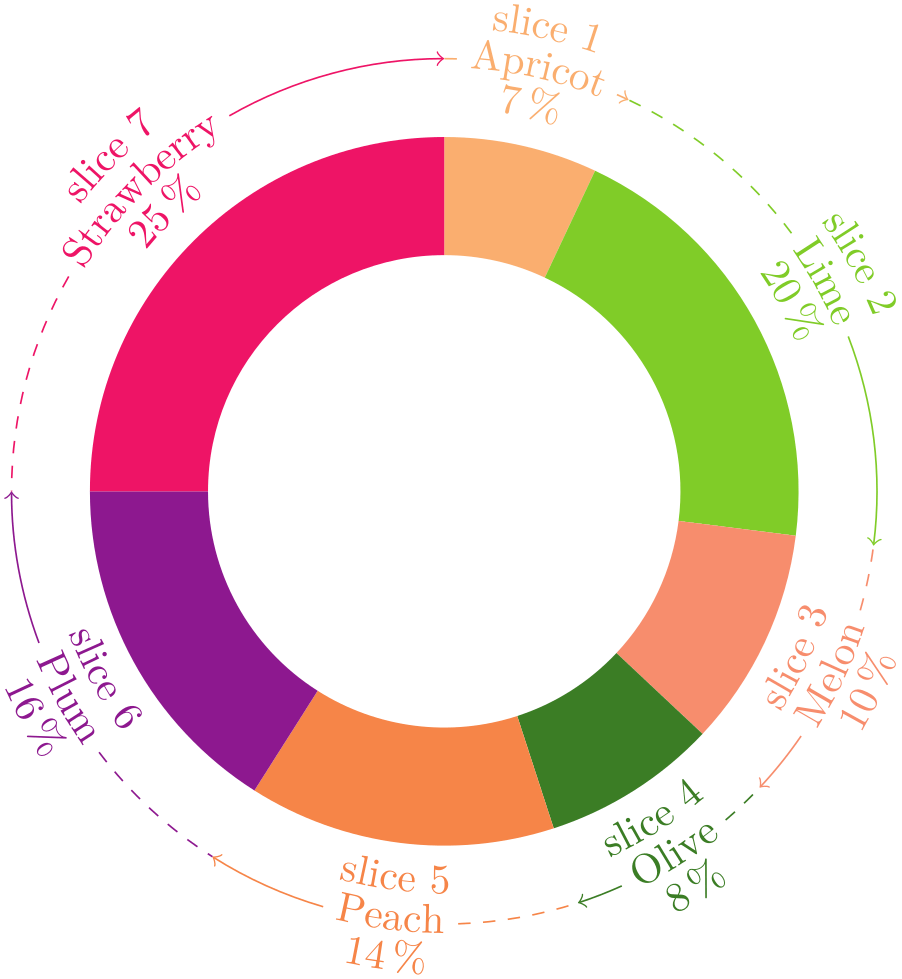
/wheelchart/arc sep={⟨value⟩} (no default, initially 1ex/1cm) 
This key determines the position of the arc similar as the corresponding key for the key data. Note that the actual distance is given by 0.5ex/1cm plus arc sep to match the option raise=-0.5ex given to the decoration for the key arc data.
\usetikzlibrary {decorations.text}

\begin{tikzpicture}

            \wheelchart[

     arc=        \WCvarB,

                  arc around line=2,

                  arc around text,

           arc data=

slice          \WCcount\\

    {~}        \WCvarC{~}\\

            \WCperc,

               arc data dir=            \WCmidangle<180?1:-1,

                  arc data expand=f,

               arc data pos=1.3,

                 arc data style={text color=        \WCvarB},

                 arc first half=dashed,

          arc pos=1.3,

                  arc second half=->,

      data=

]{                      \exampleforthismanual}

\useasboundingbox (0,0)

  circle[       radius=4.3];

\end{tikzpicture}
-
/wheelchart/at={⟨point⟩} (no default, initially (0,0)) 
This key defines the center of the wheelchart.
-
/wheelchart/before slices={⟨code⟩} (no default, initially empty) 
The ⟨code⟩ given to this key will be executed before each slice of the wheelchart.
-
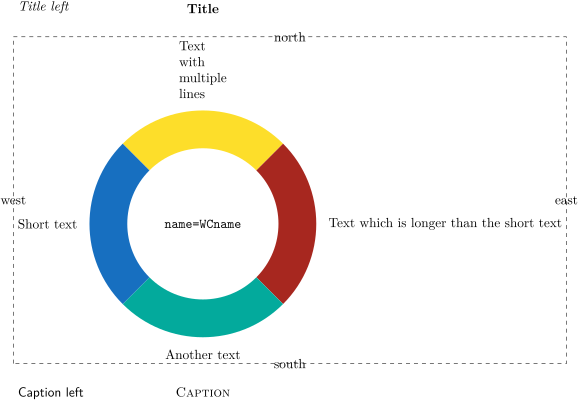
/wheelchart/caption={⟨text⟩} (no default, initially empty) 
This key contains the ⟨text⟩ which will be placed below the wheelchart. The ⟨text⟩ is placed in a node. The \(x\) coordinate of this node is the \(x\) coordinate of the center of the wheelchart, which is defined by the key at. In general, this is not the same as the \(x\) coordinate of the center of the local bounding box around the wheelchart. The \(y\) coordinate of this node is at a value determined by the key caption sep below the south of the local bounding box around the wheelchart. The style of this node is given as follows. First, the options anchor=north,align=center are given. Thereafter, the style of the key caption style is added.
-
/wheelchart/caption left={⟨text⟩} (no default, initially empty) 
This key contains the ⟨text⟩ which will be placed below left of the wheelchart. The ⟨text⟩ is placed in a node. This node is placed at a value determined by the key caption left sep below the south west of the local bounding box around the wheelchart. The style of this node is given as follows. First, the options anchor=north west,align=left are given. Thereafter, the style of the key caption left style is added.
-
/wheelchart/caption left sep={⟨value⟩} (no default, initially 0.5) 
The node where the contents of the key caption left is placed is at ⟨value⟩ below the south west of the local bounding box around the wheelchart.
-
/wheelchart/caption left style={⟨options⟩} (style, no default, initially empty) 
This key accepts a list of keys which will be applied to the node where the contents of the key caption left is placed.
-
/wheelchart/caption sep={⟨value⟩} (no default, initially 0.5) 
The \(y\) coordinate of the node where the contents of the key caption is placed is at ⟨value⟩ below the south of the local bounding box around the wheelchart.
-
/wheelchart/caption style={⟨options⟩} (style, no default, initially empty) 
This key accepts a list of keys which will be applied to the node where the contents of the key caption is placed.
\begin{tikzpicture}

             \wheelchart[

          caption=Caption,

                caption style={font=\scshape},

               caption left=Caption left,

                      caption left style={font=\sffamily},

         middle=\texttt{name=WCname},

       name=WCname,

             start half,

        title=Title,

              title style={font=\bfseries},

             title left=Title left,

                    title left style={font=\em}

]{

  1/Goldenrod/Text\\with\\multiple\\lines,

  1/Mahogany/Text which is longer than the short text,

  1/JungleGreen/Another text,

  1/RoyalBlue/Short text

}

\draw[dashed] (WCname.south west) rectangle (WCname.north east);

\foreach\pos in {north,east,south,west}{

  \node  at (WCname.\pos) {\pos};

}

\end{tikzpicture}
-
/wheelchart/contour={⟨options⟩} (style, no default, initially empty) 
If this key is set then a contour with the style determined by this key will be drawn around the wheelchart. This requires a fixed inner and outer radius for all slices. This key does not apply if a plot is used.
-
/wheelchart/counterclockwise=⟨boolean⟩ (default true, initially false) 
If true, the wheelchart will be drawn counterclockwise instead of clockwise.
-
/wheelchart/data={⟨text⟩} (no default, initially \WCvarC) 
This key contains the ⟨text⟩ which will be placed at each slice of the wheelchart. This can be suppressed by using data=. The ⟨text⟩ is placed in a node. The style of this node is given as follows. First, the anchor is set following Table 1 and Table 3. Then the option align=left is added. Thereafter, the style of the key data style is added.
-
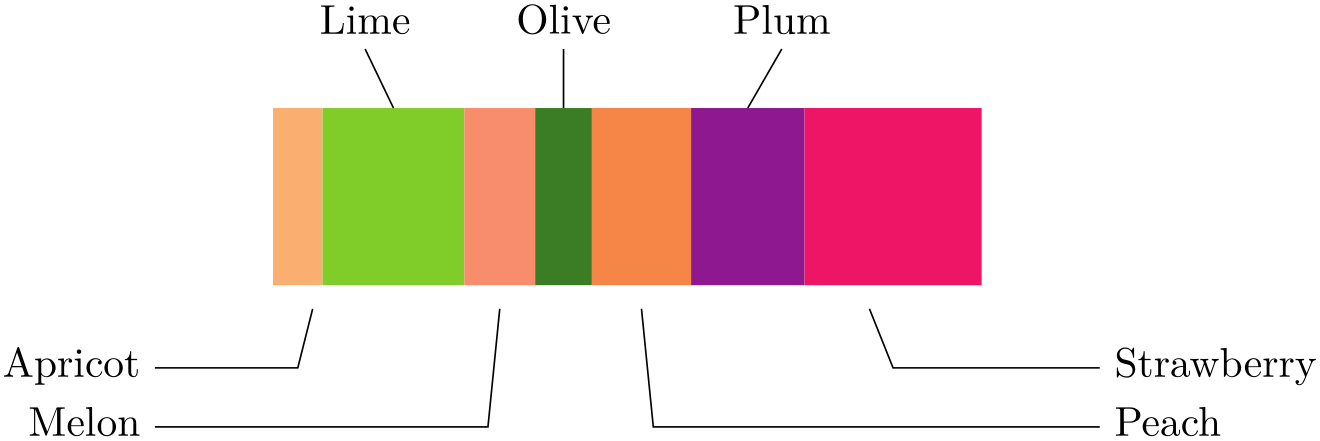
/wheelchart/data angle pos={⟨value⟩} (no default, initially 0.5) 
-
/wheelchart/data angle shift={⟨angle⟩} (no default, initially 0) 
-
/wheelchart/data pos={⟨value⟩} (no default, initially 1) 
-
/wheelchart/data sep={⟨value⟩} (no default, initially 0.2) 
-
1. The inner plot is evaluated in the point with as angle the convex combination with as parameter the key data angle pos of the inner start angle and the inner end angle, added with the key data angle shift in degrees (taking into account the key counterclockwise) and as radius the inner radius minus the key data sep.
-
2. The outer plot is evaluated in the similar point but using the outer start angle, the outer end angle and the outer radius plus the key data sep.
-
3. If \(\text {|lines|}\neq 0\) then the values of the keys lines sep and lines are added to the radii above, in addition to the key data sep.
-
4. The contents of the key data is placed at the convex combination with as parameter the key data pos of the previous two points.
If no plot is used then the position of the contents of the key data is determined as described for the commands \WCangle and \WCradius.
If a plot is used then the position of the contents of the key data is determined as follows.
\begin{tikzpicture}

            \wheelchart[

  data angle pos{2}=0.3,

  data angle pos{6}=0.8,

  data angle shift{3}=-0.1,

  data angle shift{5}=0.1,

          data pos=\WClistB,

          data sep=0,

  lines{1,2,4,6,7}=0.5,

  lines{3,5}=1,

  lines angle pos{1}=0.8,

  lines angle shift{7}=-0.2,

           lines ext=\WClistA,

  lines ext dir{1,...,3}=left,

  lines ext dir{4,...,7}=right,

                  lines ext fixed,

                       lines ext fixed left=-1,

                        lines ext fixed right=7,

           lines pos=\WClistB,

           lines sep=0.2*\WClistA,

      xbar={6}{1.5},

  WClistA={1,0},

  WClistB={0,1},

             wheel data=        \WCperc,

                 wheel data pos=0.5,

  wheel data pos{1}=1,

  wheel data pos{4}=0,

                 wheel data sep=0.2

]{                      \exampleforthismanual}

\end{tikzpicture}
-
/wheelchart/data style={⟨options⟩} (style, no default, initially empty) 
This key accepts a list of keys which will be applied to the node where the contents of the key data is placed.
-
/wheelchart/discrete=⟨boolean⟩ (default true, initially false) 
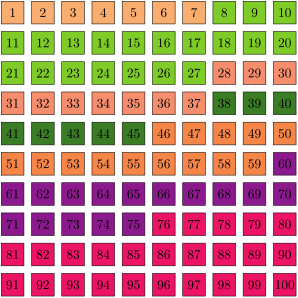
If true then TikZ pics are placed with the ⟨code⟩ determined by the key discrete pic. The number of pics is determined by the key value. It is required to set the key discrete space at borders.
-
/wheelchart/discrete factor={⟨value⟩} (no default, initially 1) 
The algorithm to place the TikZ pics depends on the ⟨value⟩. The value 1 is recommended.
-
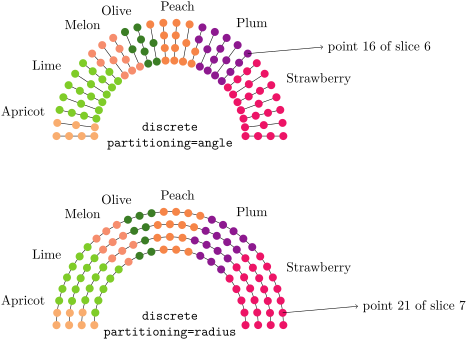
/wheelchart/discrete partitioning=angle|radius (no default, initially radius) 
- angle
-
In this case, the TikZ pics are placed uniformly with respect to the angle.
- radius
-
In this case, the TikZ pics are placed uniformly with respect to the radius.
These options are illustrated in the examples below.
\begin{tikzpicture}

\pgfkeys{

  /wheelchart,

           discrete,

               discrete pic={\fill (0,0) circle[       radius=3pt];},

                             discrete space at borders=false,

               middle style={font=\ttfamily},

              start angle=180,

              total angle=180,

        value=        \WCvarA/2

}

\foreach\angle in {0,...,27}{

  \draw ({180*(\angle/27)}:2)--({180*(\angle/27)}:3);

}

             \wheelchart[

                         discrete partitioning=angle,

         middle={         discrete\\partitioning=angle}

]{                       \exampleforthismanual}

\draw[->] (\WCcoordinate[6]{16})--++(5:2) node[right] {point 16 of slice 6};

\foreach\radius in {0,...,3}{

  \draw (2+\radius/3,-5)     arc[            start angle=0,end angle=180,       radius=2+\radius/3];

}

             \wheelchart[

   at={(0,-5)},

         middle={         discrete\\partitioning=radius}

]{                       \exampleforthismanual}

\draw[->] (\WCcoordinate[7]{21})--++(5:2) node[right] {point 21 of slice 7};

\end{tikzpicture}
-
/wheelchart/discrete pic={⟨code⟩} (no default, initially empty) 
The ⟨code⟩ determines the TikZ pics.
\begin{tikzpicture}[yscale=-1]

            \wheelchart[

      data=,

          discrete,

               discrete pic={

    \fill[draw=black] (-0.3,-0.3)

      rectangle +(0.6,0.6);

    \node[black]  at (0,0)

      {                 \WCcountdiscrete};

  },

                            discrete space at borders,

       value=        \WCvarA/2,

      ybar={8}{8}

]{                      \exampleforthismanual}

\end{tikzpicture}
-
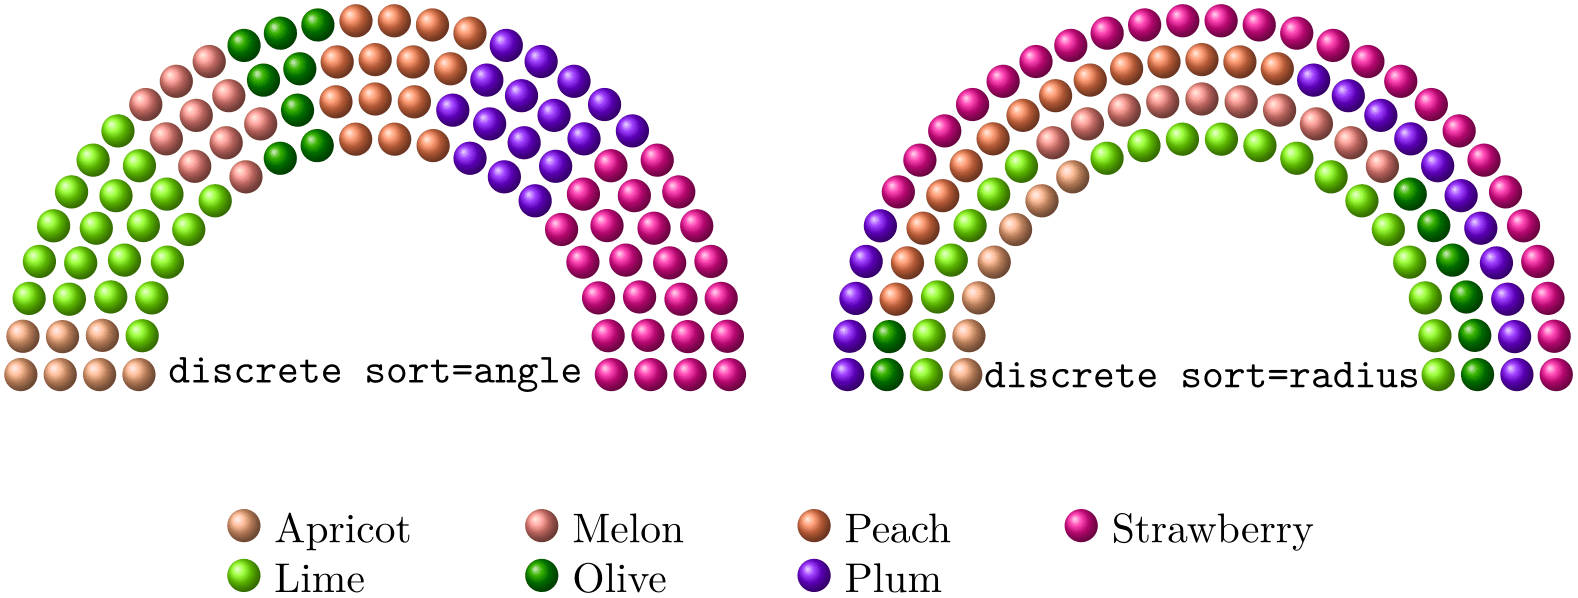
/wheelchart/discrete sort=angle|radius (no default, initially angle) 
- angle
-
In this case, the TikZ pics are ordered with respect to the angle.
- radius
-
In this case, the TikZ pics are ordered with respect to the radius.
These options are illustrated in the examples below.
\begin{tikzpicture}

\pgfkeys{

  /wheelchart,

      data=,

           discrete,

               discrete pic={\shade[ball color=        \WCvarB] (0,0) circle[       radius=4pt];},

                             discrete space at borders=false,

               middle style={font=\ttfamily},

              start angle=180,

              total angle=180,

        value=        \WCvarA/2

}

             \wheelchart[

                 legend columns=4,

             legend row={\tikz\shade[ball color=        \WCvarB] (0,0) circle[       radius=4pt]; &         \WCvarC &         \WCperc},

         legend={\node[below]  at (3.5,-1) {\begin{tabular}{*{4}{l@{ }lr}}           \WClegend\end{tabular}};},

         middle={         discrete sort=angle}

]{                       \exampleforthismanual}

             \wheelchart[

   at={(7,0)},

                discrete sort=       radius,

         middle={         discrete sort=radius}

]{                       \exampleforthismanual}

\end{tikzpicture}
-
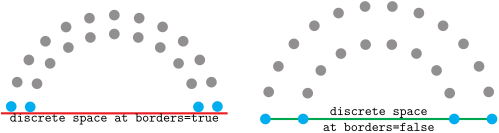
/wheelchart/discrete space at borders=⟨boolean⟩ (default true) 
This key determines whether space is left at the begin and end where the TikZ pics are placed. For example, suppose that \(3\) TikZ pics are placed at positions between \(0\) and \(1\). If discrete space at borders is true then these are placed at the positions \(\frac {1}{6}\), \(\frac {3}{6}\) and \(\frac {5}{6}\). If discrete space at borders is false then these are placed at the positions \(0\), \(\frac {1}{2}\) and \(1\).
This key deliberately has no initial value in order to force awareness of the consequences of the settings of this key. In the example below, the cyan TikZ pics are aligned if discrete space at borders is false while this is not the case if discrete space at borders is true.
\begin{tikzpicture}

\pgfkeys{

  /wheelchart,

           discrete,

               discrete pic={\fill (0,0) circle[      radius=4pt];},

               middle style={font=\ttfamily},

              start angle=180,

              total angle=180

}

\draw[Red,ultra thick] (-3,0.15)--+(6,0);

            \wheelchart[

                             discrete space at borders,

         middle={         discrete space  at borders=true}

]{2/Cyan/,20/Gray/,2/Cyan/}

\draw[Green,ultra thick] (4,0)--+(6,0);

            \wheelchart[

   at={(7,0)},

                             discrete space at borders=false,

         middle={         discrete space\\at borders=false}

]{2/Cyan/,20/Gray/,2/Cyan/}

\end{tikzpicture}
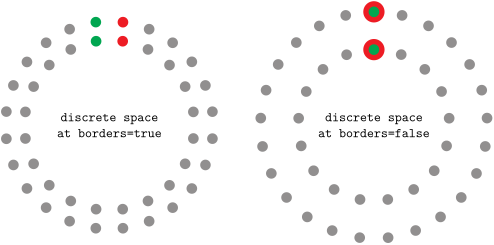
In the example below, the red and green TikZ pics overlap if discrete space at borders is false while this is not the case if discrete space at borders is true.
\begin{tikzpicture}

\pgfkeys{

  /wheelchart,

           discrete,

               discrete pic={\fill (0,0) circle[      radius=\WClistradius pt];},

               middle style={font=\ttfamily}

}

            \wheelchart[

                            discrete space at borders,

         middle={         discrete space\\at borders=true},

  WClistradius=4

]{2/Red/,40/Gray/,2/Green/}

            \wheelchart[

   at={(7,0)},

                            discrete space at borders=false,

         middle={         discrete space\\at borders=false},

  WClistradius={8,4,4}

]{2/Red/,40/Gray/,2/Green/}

\end{tikzpicture}
-
/wheelchart/domain={⟨start⟩}:{⟨end⟩}(no default) 
This key sets counterclockwise, start angle to ⟨start⟩ and total angle to \(\text {\meta {end}}-\text {\meta {start}}\).
-
/wheelchart/etoc code={⟨code⟩} (no default, initially \tableofcontents) 
The ⟨code⟩ will be executed to build the ⟨wheelchart data⟩ if the key etoc level is used.
-
/wheelchart/etoc count total pages={⟨number⟩} (no default, initially 0) 
If the key etoc level is used then the number of pages of the last section depends on ⟨number⟩ which can for example represent the total number of pages in the document or the number of pages before the start of the Appendix or the Index. For example, etoc count total pages=\totalpages can be used. To provide the command \totalpages, this requires \usepackage[page]{totalcount}, which should normally be loaded before the package wheelchart to give a correct result.
-
/wheelchart/etoc level={⟨level⟩}(no default) 
If this key is used then the ⟨wheelchart data⟩ of the command \wheelchart can be left empty and is defined to match the sections of the level defined by ⟨level⟩. Here, \WCetocthelinkedname corresponds to \etocthelinkedname, \WCetocthelinkednumber to \etocthelinkednumber, \WCetocthelinkedpage to \etocthelinkedpage, \WCetocthename to \etocthename, \WCetocthenumber to \etocthenumber and \WCetocthepage to \etocthepage. The package etoc is required to provide these commands. Furthermore, \WCetocthenumberofpages corresponds to the number of pages of the current section. For the last section, this depends on the value of the key etoc count total pages.
-
/wheelchart/etoc name={⟨name⟩} (no default, initially empty) 
The resulting ⟨wheelchart data⟩ from the key etoc level is stored globally and can be reused later with the key etoc use name.
-
/wheelchart/etoc use name={⟨name⟩}(no default) 
If this key is used then the ⟨wheelchart data⟩ is reused from where etoc name has the same ⟨name⟩.
-
/wheelchart/expand list=false|once|true (no default, initially once) 
- false
-
In this case, the ⟨wheelchart data⟩ of the command \wheelchart will not be expanded.
- once
-
In this case, the ⟨wheelchart data⟩ of the command \wheelchart will be expanded once.
- true
-
In this case, the ⟨wheelchart data⟩ of the command \wheelchart will be fully expanded.
The following example illustrates the difference between the possible values of the key expand list.
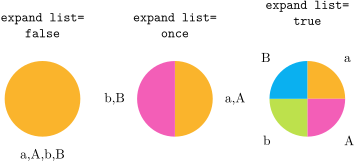
\begin{tikzpicture}

\def\WClistA{a,A}

\def\WClistB{b,B}

\def\WCdata{\WClistA,\WClistB}

\foreach\expandlist [count=\n] in

  {false,once,true}{

               \wheelchart[

     at={(3.5*\n,0)},

         data=        \WCvarA,

                expand list=\expandlist,

           radius={0}{1},

    slices style{list}={

      Dandelion,CarnationPink,

      SpringGreen,ProcessBlue


    },

          title={expand list=\\\expandlist},

                title style={font=\ttfamily},

          value=1

  ]{\WCdata}

}

\end{tikzpicture}
The initial setting expand list=once works in most situations, even when commands such as \ref, \cite and \textbf are used such as in the example below.
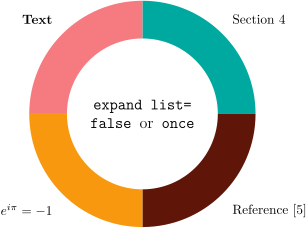
\begin{tikzpicture}

            \wheelchart[

% expand list=false,%false also works

% expand list=true,%true doesn't work

         middle={

    expand list=\\

    false {\normalfont or} once

  },

               middle style={font=\large\ttfamily}

]{

  1/Emerald/Section \ref{Keys},

  1/Sepia/Reference \cite{TtTaPGFp},

  1/YellowOrange/$e^{i\pi}=-1$,

  1/Salmon/\textbf{Text}

}

\end{tikzpicture}
In the following example, the ⟨wheelchart data⟩ from the previous example is stored in a macro. In this case, we have to use the initial setting expand list=once.
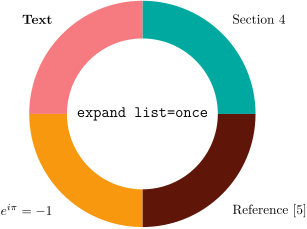
\begin{tikzpicture}

\def\WClist{

  1/Emerald/Section \ref{Keys},

  1/Sepia/Reference \cite{TtTaPGFp},

  1/YellowOrange/$e^{i\pi}=-1$,

  1/Salmon/\textbf{Text}

}

            \wheelchart[

% expand list=false,

% expand list=true,

% false and true do not work

         middle={expand list=once},

               middle style={font=\large\ttfamily}

]{\WClist}

\end{tikzpicture}
In the example below, we have to use expand list=true.

\begin{tikzpicture}

\def\WCcolorsA{Yellow,Red}

\def\WCcolorsB{Green,Blue}

            \wheelchart[

      data=,

              expand list=true,%false and once

                   %do not work

         middle={expand list=true},

               middle style={font=\large\ttfamily},

               slices style=        \WCvarA,

       value=1

]{\WCcolorsA,\WCcolorsB}

\end{tikzpicture}
In the example below, we have to use expand list=true and the command \expandonce from the package etoolbox.
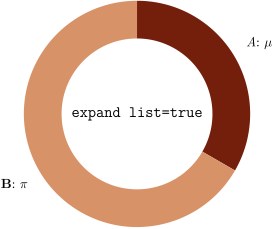
\usepackage {etoolbox}

\begin{tikzpicture}

\def\WCsliceA{1/Brown/\emph{A}: $\mu$}

\def\WCsliceAfinal{\expandonce\WCsliceA}

\def\WCsliceB{2/Tan/\textbf{B}: $\pi$}

\def\WCsliceBfinal{\expandonce\WCsliceB}

            \wheelchart[

              expand list=true,%false and once

                   %do not work

         middle={expand list=true},

               middle style={font=\large\ttfamily}

]{\WCsliceAfinal,\WCsliceBfinal}

%\WCsliceA and \WCsliceB do not work

\end{tikzpicture}
-
/wheelchart/expand list items=false|once|true (no default, initially false) 
This key is similar to the key expand list but applies to the items in the ⟨wheelchart data⟩ of the command \wheelchart which correspond to a slice of the wheelchart.

\def\WClistA{a/b}%

\def\WClistB{c/d}%

\def\WCdata{\WClistA/\WClistB}%

\texttt{expand list items}%

\foreach\expandlistitems in

  {false,once,true}{%

              \wheelchart[

                expand list=false,

                      expand list items=\expandlistitems,

           legend=; \texttt{\expandlistitems}:

              \WCvarA,

                legend only,

         value=1

  ]{\WCdata}%

}
-
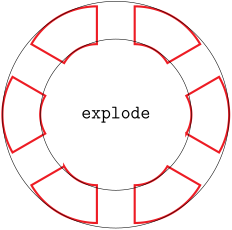
/wheelchart/explode={⟨value⟩} (default 0.2, initially 0) 
This key will shift the slices of the wheelchart with ⟨value⟩ with respect to the center of the wheelchart.
-
/wheelchart/for loop end={⟨code⟩} (no default, initially empty) 
The slices of the wheelchart, the wheel lines determined by the key wheel lines and the different kinds of data are placed in for loops. If the key for loop end is set then the ⟨code⟩ given to this key will be executed at the end of the body of these for loops.
-
/wheelchart/for loop start={⟨code⟩} (no default, initially empty) 
This key is similar to the key for loop end but the ⟨code⟩ given to this key will be executed at the start of the body of the for loops.
-
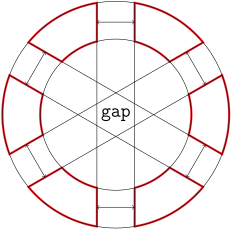
/wheelchart/gap={⟨value⟩} (default 0.05, initially 0) 
The ⟨value⟩ of this key defines half the distance between two slices of the wheelchart. This key does not apply if a plot is used.
-
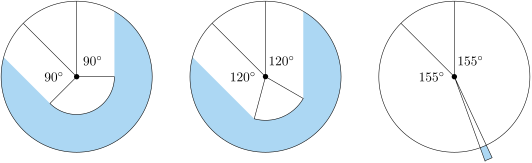
/wheelchart/gap max angle={⟨angle⟩} (no default, initially 180) 
If the value of the key gap is too large then a slice can partly disappear such as for example below when gap max angle is  . The ⟨angle⟩ of the key gap max angle determines the inner arc of the slice as illustrated in the examples below.
\usepackage {siunitx}

\begin{tikzpicture}

\foreach\gapmaxangle [count=\n] in {90,120,155}{

  \begin{scope}[shift={(5*\n,0)}]

                \wheelchart[

         gap=1,

                    gap max angle=\gapmaxangle,

            radius={0}{2},

                 total angle=315

    ]{1/CornflowerBlue!50/}

    \fill (0,0) circle[      radius=2pt];

    \draw (0,0) circle[      radius=2];

    \draw (135:2)--(0:0)--(90:2);

    \draw (0:0)--(135+\gapmaxangle:{1/sin(\gapmaxangle)})    arc[           start angle=135+\gapmaxangle,

      end angle=450-\gapmaxangle,      radius=1/sin(\gapmaxangle)]--cycle;

    \node  at (45:0.6) {\ang{\gapmaxangle}};

    \node  at (180:0.6) {\ang{\gapmaxangle}};

  \end{scope}

}

\end{tikzpicture}
-
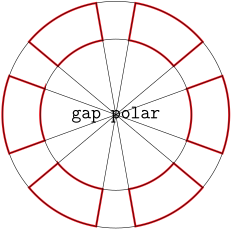
/wheelchart/gap polar={⟨value⟩} (default 1, initially 0) 
The ⟨value⟩ of this key defines half the polar gap in degrees between two slices of the wheelchart.
Note the difference between the keys explode, gap and gap polar. This is illustrated in the examples below.
\begin{tikzpicture}

            \wheelchart[

          explode=1,

         middle=\Large\texttt{        explode},

         radius={1}{2},

               slices style={

    draw=Red,

    fill=none,

    ultra thick


  },

              total count=6

]{}

\draw (0,0) circle[       radius=2]

  circle[       radius=3];

\end{tikzpicture}
\begin{tikzpicture}

            \wheelchart[

     gap=0.5,

               legend entry=

\draw (\WCcoordinate{outer end})

      --(\WCcoordinate[\WCcount -2]

        {outer start});

    \draw[<->] (\WCpoint{1}{0}{0.5}{0})

      --(\WCpoint[\WCcount +1]

{0}{0}{0.5}{0});,

  middle=\Large\texttt{   gap},

         slices style={

    draw=Red,

    fill=none,

    ultra thick

  },

  total count=6

]{}

\draw (0,0) circle[       radius=2]

  circle[       radius=3];

\end{tikzpicture}
\begin{tikzpicture}

           \wheelchart[

           gap polar=10,

  legend entry{1,2,3}=

\draw (\WCcoordinate{outer start})

      --(\WCcoordinate[\WCcount +3]

        {outer start});

    \draw (\WCcoordinate{outer end})

      --(\WCcoordinate[\WCcount +3]

{outer end});,

  middle=\Large\texttt{   gap polar},

        slices style={

    draw=Red,

    fill=none,

    ultra thick

  },

  total count=6

]{}

\draw (0,0) circle[      radius=2]

  circle[      radius=3];

\end{tikzpicture}
-
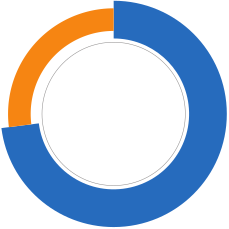
/wheelchart/gap radius={⟨value⟩} (default 0.05, initially 0) 
The ⟨value⟩ of this key will be added to inner radius and substracted from outer radius.
\usepackage {siunitx}

\begin{tikzpicture}

\def\n{73}

           \wheelchart[

      data=,

            gap radius=       \WCvarC,

        middle=\Huge\qty{\n}{\percent}

]{

  \n/NavyBlue/0,

  100-\n/BurntOrange/0.2

}

\draw[Gray] (0,0) circle[      radius=1.9];

\end{tikzpicture}
-
/wheelchart/header={⟨list⟩}(no default) 
The items in the ⟨list⟩ determine the names in the macros \⟨prefix⟩⟨name⟩.
-
/wheelchart/header prefix={⟨prefix⟩} (no default, initially WC) 
The ⟨prefix⟩ is used in the macros \⟨prefix⟩⟨name⟩.
-
/wheelchart/inner data={⟨text⟩} (no default, initially empty) 
This key contains the ⟨text⟩ which will be placed at each slice of the wheelchart. The ⟨text⟩ is placed in a node. The style of this node is given as follows. First, the option align=left is given. Thereafter, the style of the key inner data style is added.
-
/wheelchart/inner data angle pos={⟨value⟩} (no default, initially 0.5) 
-
/wheelchart/inner data angle shift={⟨angle⟩} (no default, initially 0) 
-
/wheelchart/inner data pos={⟨value⟩} (no default, initially 0) 
-
/wheelchart/inner data sep={⟨value⟩} (no default, initially 0.2) 
These keys determine the position of the contents of the key inner data similar as the corresponding keys for the key data. No lines are drawn for the inner data.
-
/wheelchart/inner data style={⟨options⟩} (style, no default, initially empty) 
This key accepts a list of keys which will be applied to the node where the contents of the key inner data is placed.
-
/wheelchart/inner plot={⟨code⟩}(no default) 
The ⟨code⟩ is a coordinate definition which will be used for the inner parts of the slices of the wheelchart. In the ⟨code⟩, #1 and #2 can be used where #1 corresponds to the angle and #2 corresponds to the radius. For example, a circle can be obtained with inner plot={{#1}:{#2}}.
-
/wheelchart/inner plot style={⟨options⟩} (style, no default, initially empty) 
This key accepts a list of keys which will be applied to the plot determined by the key inner plot.
-
/wheelchart/inner radius={⟨value⟩} (no default, initially 2) 
The ⟨value⟩ of this key defines the inner radius of the wheelchart.
-
/wheelchart/legend={⟨code⟩} (no default, initially empty) 
The ⟨code⟩ given to this key will be executed at the end of the command \wheelchart.
-
/wheelchart/legend columns={⟨number⟩} (no default, initially 1) 
If the key legend row is used then the maximum number of times that the ⟨code⟩ given to the key legend row appears on one row is determined by ⟨number⟩. The environment (for example tabular, tabularx from the package tabularx, tabulary from the package tabulary or tblr from the package tabularray) which contains the macro \WClegend needs to have a suitable column specification according with ⟨number⟩ and the key legend row.
-
/wheelchart/legend entry={⟨code⟩} (no default, initially empty) 
The ⟨code⟩ given to this key will be executed for each slice of the wheelchart.
-
/wheelchart/legend only=⟨boolean⟩ (default true, initially false) 
If true then only the legend is constructed. This does not apply to the key legend entry.
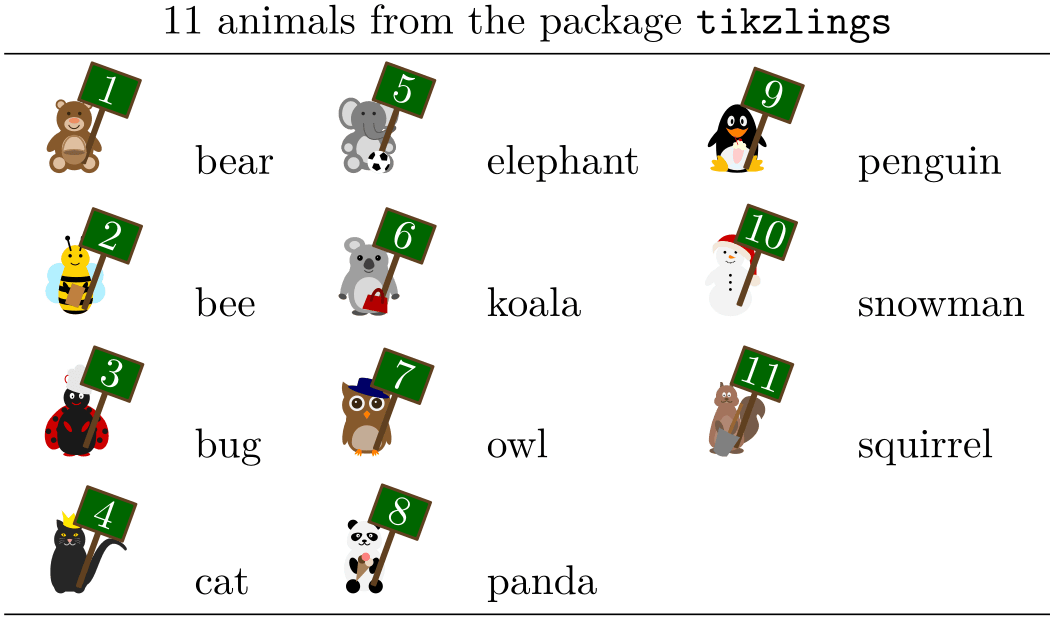
In this case it is not necessary to place the command \wheelchart in a tikzpicture environment.
\usepackage {tikzlings}

             \wheelchart[

         header={animal,accessory},

                 legend columns=3,

              legend only,

             legend row={\tikz[scale=0.3]{

    \csname \WCanimal\endcsname[

      signpost=          \WCcount,

      \WCaccessory

    ]} & \WCanimal},

         legend=

\begin{tabular}{*{3}{cl}}

    \multicolumn{6}{c}{

                     \WCtotalcount{} animals

      from the package

      \texttt{tikzlings}}\\\hline

               \WClegend\hline

    \end{tabular},

                     separator columns={{ }},

                 separator rows=;,

        value=1

]{

  bear basket;

  bee book;

  bug chef;

  cat crown;

  elephant football;

  koala handbag;

  owl hat;

  panda icecream;

  penguin milkshake;

  snowman santa;

  squirrel shovel

}
-
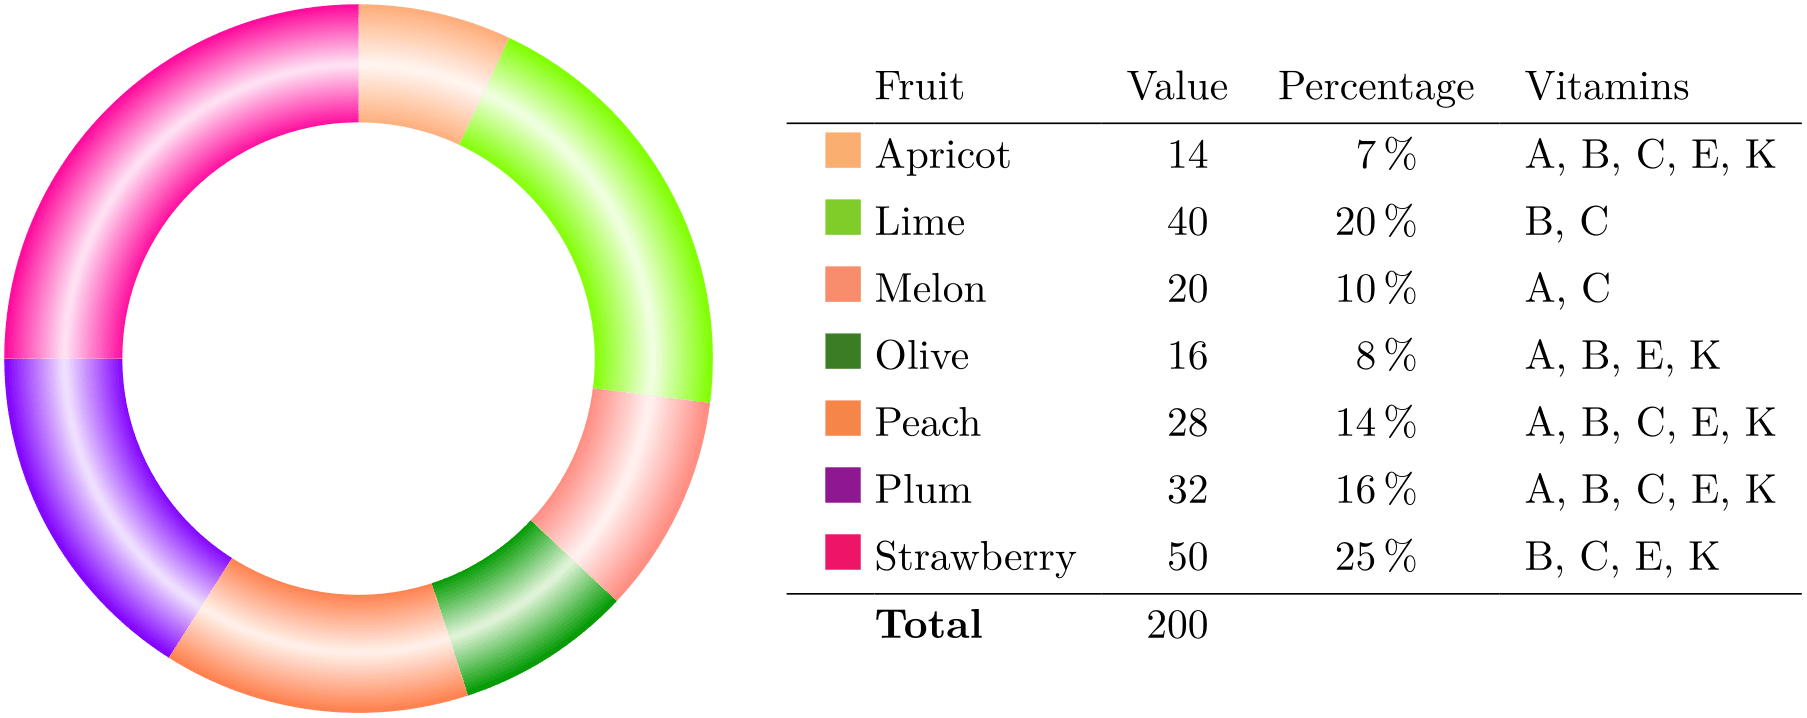
/wheelchart/legend row={⟨code⟩}(no default) 
If this key is set then a legend consisting of rows for an environment such as tabular, tabularx from the package tabularx, tabulary from the package tabulary or tblr from the package tabularray is constructed using the ⟨code⟩ for each slice of the wheelchart.
If a tblr environment from the package tabularray is used then \UseTblrLibrary{counter} is required.
The maximum number of times that the ⟨code⟩ appears on one row is determined by the key legend columns.
The code automatically inserts & and \\ after the ⟨code⟩ if necessary.
The result is stored in the macro \WClegend.
\usepackage {tabularray} \UseTblrLibrary {counter,siunitx}

\begin{tikzpicture}

            \wheelchart[

               after slices={

    \pgfdeclareradialshading{WCshading}{\pgfpoint{0cm}{0cm}}{

      color(0bp)=(\WCvarB);

      color(16.66666bp)=(\WCvarB);%2/3 * 25bp

      color(20.83333bp)=(\WCvarB!10);%2.5/3 * 25bp

      color(25bp)=(\WCvarB);

      color(50bp)=(\WCvarB)

    }

    \shade[even odd rule,shading=WCshading] (0,0) circle[      radius=3] circle[      radius=2];

  },

      data=,

             legend row={\tikz\fill[        \WCvarB] (0,0) rectangle (0.3,0.3);

     &         \WCvarC &         \WCvarA &                      \WCpercentagerounded & \WCvarD},

         legend={

    \node[right]  at (3.5,0) {

      \begin{tblr}{

        colspec={llS[table-format=3.0]S[table-format=2.0{\,\unit{\percent}}]l},

        column{1}={rightsep=0pt,appto=\ },

        column{2}={leftsep=0pt},

        cell{2-Y}{4}={appto=\,\unit{\percent}},

        row{1}=guard

      }

       & Fruit & Value & Percentage & Vitamins\\\hline

                \WClegend\hline

       & \textbf{Total} &             \WCtotalnum & & \\

      \end{tblr}

    };

  },

               slices style={

    fill=none,

    clip


  }

]{                      \exampleforthismanual}

\end{tikzpicture}
-
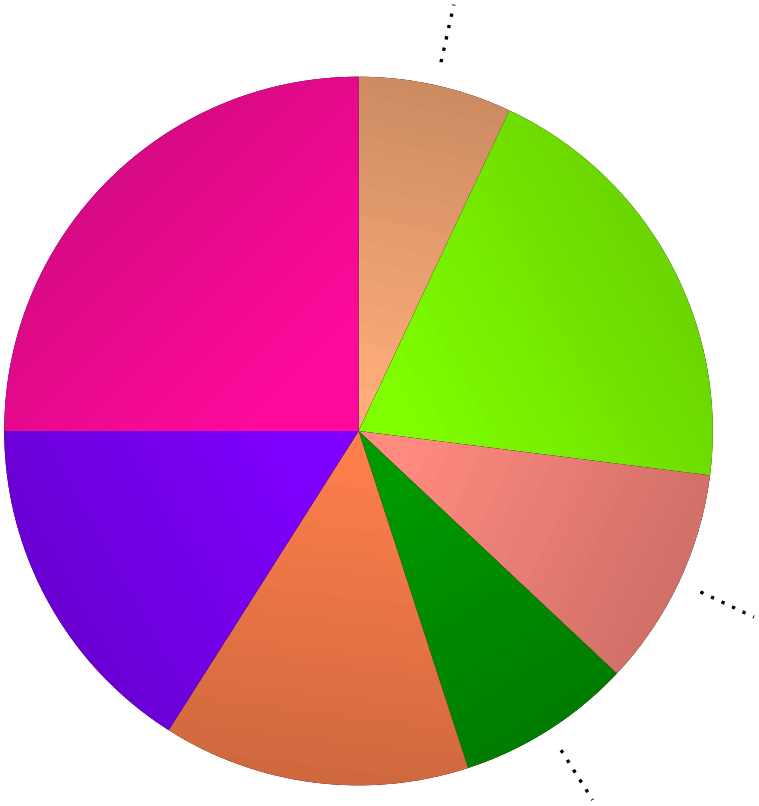
/wheelchart/lines={⟨value⟩} (default 1, initially 0) 
The ⟨value⟩ is used in the positioning of the contents of the key data. The end point of the lines is determined similarly but without the key data sep.
\usepackage {siunitx}

\begin{tikzpicture}

\def\WCtest#1#2{

  \pgfmathparse{

                   \WCpercentage>10?"#1":"#2"

  }

  \pgfmathresult

}

             \wheelchart[

      data=\WCtest{}{        \WCperc},

        lines=               \WCpercentage>10?0:0.5,

              lines style={dotted,thick},

     pie,

               slices style={

    bottom color=        \WCvarB,

    top color=        \WCvarB!80!black,

    shading angle=\WCmidangle-90

  },

             wheel data=\WCtest{        \WCperc}{}

]{                       \exampleforthismanual}

\end{tikzpicture}
-
/wheelchart/lines angle pos={⟨value⟩} (no default, initially 0.5) 
-
/wheelchart/lines angle shift={⟨angle⟩} (no default, initially 0) 
These keys are similar to the corresponding keys for data but determine the start point of the lines.
-
/wheelchart/lines ext={⟨value⟩} (default 0.5, initially 0) 
If the ⟨value⟩ of this key is nonzero and lines ext fixed is false then the lines between the wheelchart and the contents of the key data will be extended horizontally with a length defined by ⟨value⟩.
-
/wheelchart/lines ext bottom dir=left|right (no default, initially right) 
-
/wheelchart/lines ext dir=left|right(no default) 
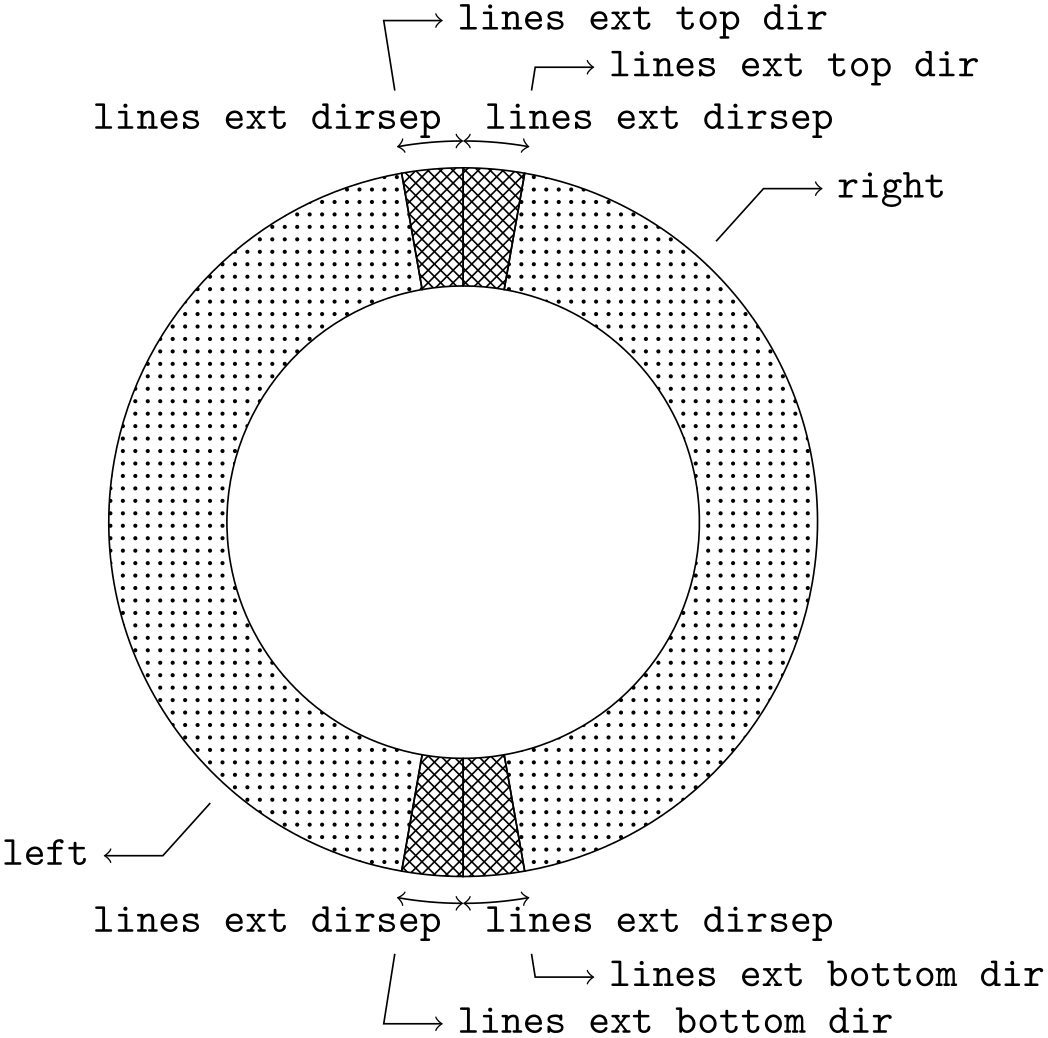
The default direction in which the lines between the wheelchart and the contents of the key data will be extended horizontally if \(\text {|lines ext|}\neq 0\) is determined by Table 2 and illustrated in the following example. This can be overruled by giving an explicit value to this key. Note that rounding errors can occur in the computation of the angle which is used to determine the default direction according to Table 2.
| The direction in which the lines between the | |
| wheelchart and the contents of the key data will | |
| be extended horizontally if \(\text {|lines ext|}\neq 0\) and | |
| Angle (up to rounding errors) | if the key lines ext dir is not used |
| \(\rinterval {0}{90-\text {|lines ext dirsep|}}\) | right |
| \([90-\text {|lines ext dirsep|},90+\text {|lines ext dirsep|}]\) | value of the key lines ext top dir |
| \(\ointerval {90+\text {|lines ext dirsep|}}{270-\text {|lines ext dirsep|}}\) | left |
| \([270-\text {|lines ext dirsep|},270+\text {|lines ext dirsep|}]\) | value of the key lines ext bottom dir |
| \(\ointerval {270+\text {|lines ext dirsep|}}{360}\) | right |
Table 2: The direction in which the lines between the wheelchart and the contents of the key data will be extended horizontally if \(\text {\ttfamily lines ext}\neq 0\) and if the key lines ext dir is not used.
\usetikzlibrary {patterns}

\begin{tikzpicture}[font=\ttfamily]

\def\WClinesextdirsep{10}

            \wheelchart[

  data{1,6}=     lines ext top dir,

  data{2}=right,

  data{3,4}=     lines ext bottom dir,

  data{5}=left,

                data angle pos=\WClistdap,

          data sep=0,

  inner data angle pos{1,4}=0.1,

  inner data angle pos{3,6}=0.9,

                inner data pos=1,

                inner data sep=0.4,

                   inner data style=\WClistia,

       lines=0.6,

  lines{1,3}=0.2,

                 lines angle pos=\WClistdap,

           lines ext,

                   lines ext dirsep=\WClinesextdirsep,

  lines sep{list}={0.7,0.2,0.7},

             lines style=->,

  slice{1,3,4,6}={

    arc=<->,

    inner data=lines ext dirsep,

    value=\WClinesextdirsep

  },

              slices style={

    draw,

    pattern=\WClistpattern

  },

             total count=6,

  value{2,5}=180-2*\WClinesextdirsep,

  WClistdap={0.9,0.2,0.1},

  WClistia={right,left},

  WClistpattern={

    crosshatch,dots,crosshatch

  }

]{}

\end{tikzpicture}
-
/wheelchart/lines ext dirsep={⟨angle⟩} (no default, initially 0) 
This key determines half the angle in degrees of the segment to which the keys lines ext bottom dir and lines ext top dir apply.
-
/wheelchart/lines ext fixed=⟨boolean⟩ (default true, initially false) 
If true, the line between the wheelchart and the contents of the key data will be extended horizontally till the \(x\) coordinate determined by the keys lines ext fixed left and lines ext fixed right.
-
/wheelchart/lines ext fixed left={⟨value⟩}(no default) 
-
/wheelchart/lines ext fixed right={⟨value⟩}(no default) 
If lines ext fixed is true, the lines are extended horizontally initially to the right till the \(x\) coordinate \(\text {|outer radius|}+\text {|lines sep|}+\text {|lines|}+\text {|lines ext|}\) and to the left till the opposite of this \(x\) coordinate. This can be overruled by giving an explicit value to the key lines ext fixed left and/or lines ext fixed right.
-
/wheelchart/lines ext left anchor={⟨anchor⟩} (no default, initially mid east) 
-
/wheelchart/lines ext right anchor={⟨anchor⟩} (no default, initially mid west) 
| The direction in which the lines between the | |
| wheelchart and the contents of the key data will | |
| be extended horizontally if \(\text {|lines ext|}\neq 0\) | Anchor of the key data |
| left | value of the key lines ext left anchor |
| right | value of the key lines ext right anchor |
Table 3: Anchor of the key data in the case that \(\text {\ttfamily lines ext}\neq 0\).
-
/wheelchart/lines ext top dir=left|right (no default, initially right) 
-
/wheelchart/lines pos={⟨value⟩} (no default, initially 1) 
-
/wheelchart/lines sep={⟨value⟩} (no default, initially 0.2) 
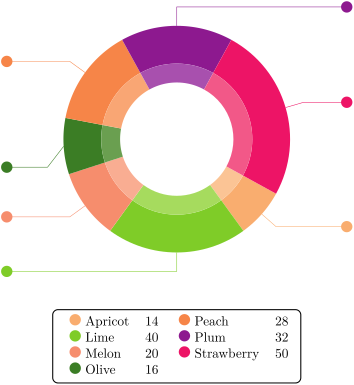
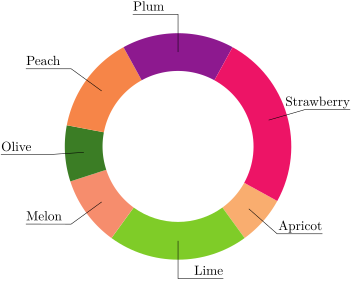
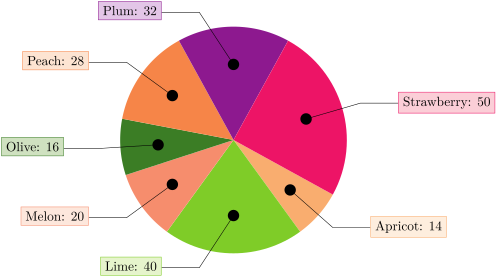
These keys are similar to the corresponding keys for data but determine the start point of the lines.
-
/wheelchart/lines style={⟨options⟩} (style, no default, initially empty) 
This key accepts a list of keys which will be applied to the lines drawn by the key lines.
\usepackage {siunitx} \usetikzlibrary {decorations.markings}

\begin{tikzpicture}

             \wheelchart[

      data=        \WCperc,

  data angle pos{4}=0.2,

% data style={outer xsep=4pt},

                 legend columns=2,

             legend row={\tikz\fill[        \WCvarB] (0,0) circle[       radius=0.15]; &         \WCvarC & $        \WCvarA$},

         legend={

    \node[below,draw,rounded corners,thick]  at (0,-4.5) {

      \begin{tabular}{*{2}{l@{ }lr}}

                 \WClegend

      \end{tabular}

    };

  },

        lines=0.5,

            lines ext=1,

                        lines ext bottom dir=left,

                    lines ext dirsep=1,

                  lines ext fixed,

                     lines ext top dir=right,

            lines sep=0,

              lines style={

            \WCvarB,

    postaction=decorate,

    decoration={

      markings,

      mark=at position 1 with {\fill[        \WCvarB] (0,0) circle[       radius=0.15];}

    }

  },

              start angle=331.2

]{                       \exampleforthismanual}

             \wheelchart[

      data=,

         radius={1.5}{2},

               slices style=        \WCvarB!70,

              start angle=331.2

]{                       \exampleforthismanual}

\end{tikzpicture}
\begin{tikzpicture}

             \wheelchart[

           data sep=0,

             data style={

    inner sep=0pt,

    shift={(0,0.1)}

  },

        lines=0.5,

            lines ext=1.2,

                        lines ext bottom dir=right,

                    lines ext dirsep=1,

% lines ext fixed,

                         lines ext left anchor=base west,

                          lines ext right anchor=base east,

                     lines ext top dir=left,

            lines pos=0.5,

            lines sep=0,

% lines style=\WCvarB,

              start angle=331.2

]{                       \exampleforthismanual}

\end{tikzpicture}
\usetikzlibrary {decorations.markings}

\begin{tikzpicture}

             \wheelchart[

      data=        \WCvarC:         \WCvarA,

                    data angle shift=\WCvarG,

           data sep=0,

             data style={draw=        \WCvarB,fill=        \WCvarB!20},

        lines=1.5,

            lines ext=1,

            lines sep=-1,

              lines style={

    postaction=decorate,

    decoration={

      markings,

      mark=at position 0 with {\fill (0,0) circle[       radius=0.15];}

    }

  },

     pie,

              start angle=331.2

]{                       \exampleforthismanual}

\end{tikzpicture}
-
/wheelchart/middle={⟨text⟩} (no default, initially empty) 
This key contains the ⟨text⟩ which will be placed at the center of the wheelchart. The ⟨text⟩ is placed in a node. The style of this node is given as follows. First, the option align=center is given. Thereafter, the style of the key middle style is added.
-
/wheelchart/middle fill={⟨options⟩} (style, no default, initially empty) 
If this key is set then the middle of the wheelchart will be filled with this style. This requires a fixed inner and outer radius for all slices. This key does not apply if a plot is used.
-
/wheelchart/middle style={⟨options⟩} (style, no default, initially empty) 
This key accepts a list of keys which will be applied to the node where the contents of the key middle is placed.
-
/wheelchart/name={⟨name⟩} (no default, initially wheelchart@name) 
This key defines the ⟨name⟩ of the local bounding box around the wheelchart.
-
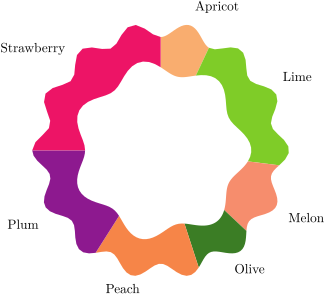
/wheelchart/outer plot={⟨code⟩}(no default) 
This key is similar to the key inner plot but determines the outer parts of the slices of the wheelchart.
\begin{tikzpicture}

           \wheelchart[

            inner plot={{#1}:{#2+0.2*(cos(#1*\WCtotalcount)+1)}},

            outer plot={{#1}:{#2+0.2*(cos(#1*\WCtotalcount*2)+1)}}

]{                     \exampleforthismanual}

\end{tikzpicture}
\usetikzlibrary {decorations.text}

\begin{tikzpicture}

             \wheelchart[

           arc data=slice           \WCcount\\|\bfseries|        \WCvarC,

                  arc data expand=f,

               arc data pos=0.5,

                            arc data line sep factor=1.5,

      data=,

         domain=0:450,

             inner plot={

    {int((#1)/180)*5+(0.5-((-1)^Mod(int((#1)/180),2))*2.5)*cos(#1)},

    {(2.5-((-1)^Mod(int((#1)/180),2))*0.5)*sin(#1)}

  },

             outer plot={

    {int((#1)/180)*5+(-0.5-((-1)^Mod(int((#1)/180),2))*2.5)*cos(#1)},

    {(2.5+((-1)^Mod(int((#1)/180),2))*0.5)*sin(#1)}

  },

        value=width("\WCvarC")

]{                       \exampleforthismanual}

\end{tikzpicture}
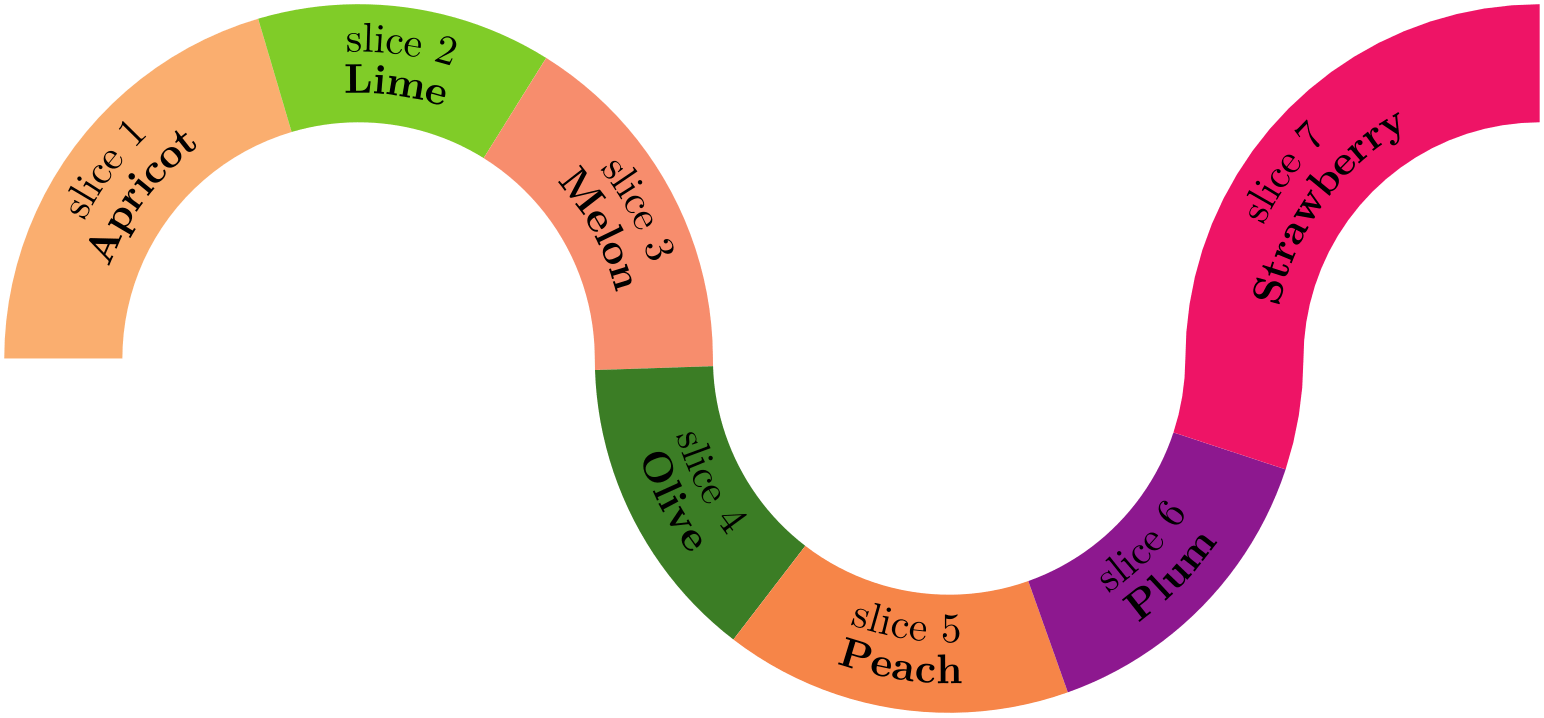
-
/wheelchart/outer plot style={⟨options⟩} (style, no default, initially empty) 
This key accepts a list of keys which will be applied to the plot determined by the key outer plot.
-
/wheelchart/outer radius={⟨value⟩} (no default, initially 3) 
The ⟨value⟩ of this key defines the outer radius of the wheelchart.
-
/wheelchart/perc precision={⟨number⟩} (no default, initially 0) 
This key defines the number of decimals up to which the percentage in the macros \WCperc and \WCpercentagerounded is rounded. The rounding is performed with l3fp. With the initial setting, for example 49.5 and 50.5 are both rounded to 50. With perc precision={0,1}, 49.5 is rounded to 50 and 50.5 to 51.
-
/wheelchart/pie=⟨boolean⟩ (default true, initially false) 
If true, the inner radius of the wheelchart is set to 0.
-
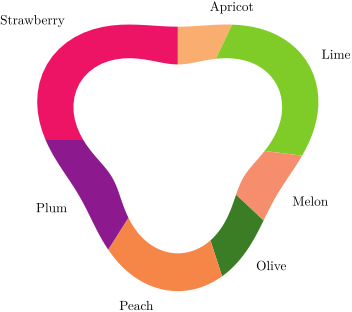
/wheelchart/plot={⟨code⟩}(no default) 
This key sets inner plot and outer plot.
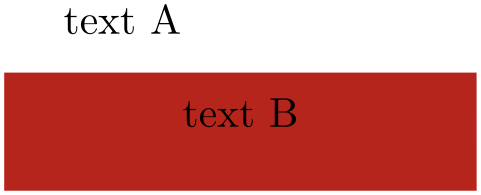
Since the let operation from the TikZ library calc is used, it is not possible to use the variable names \n, \p, \x and \y inside the ⟨code⟩.
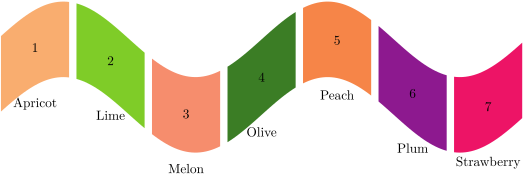
Note that positions depend on the domain and not on the length of the plot. For example below, data angle pos=0.5. The corresponding value of the domain is \(1\) which gives the \(x\) coordinate \(1\) which is not in the middle of the plot. Whereas wheel data angle pos=sqrt(2)/2. The corresponding value of the domain is \(\sqrt {2}\) which gives the \(x\) coordinate \(2\) which is in the middle of the plot.
\begin{tikzpicture}

            \wheelchart[

        domain=0:2,

      plot={{(#1)^2},{#2}},

             wheel data=text B,

                       wheel data angle pos=sqrt(2)/2

]{1/BrickRed/text A}

\end{tikzpicture}
\begin{tikzpicture}

           \wheelchart[

      plot={{#1}:{0.5*(sin(#1*3)+1)+#2}}

]{                     \exampleforthismanual}

\end{tikzpicture}
\begin{tikzpicture}

             \wheelchart[

         domain=0:720,

            gap polar=5,

      plot={{#1*3.5/180},{sin(#1)-#2}},

         radius={0}{2},

        value=1,

             wheel data=          \WCcount,

                 wheel data pos=0.5

]{                       \exampleforthismanual}

\end{tikzpicture}
\usetikzlibrary {decorations.text}

\begin{tikzpicture}

            \wheelchart[

           arc data=        \WCvarC,

               arc data dir=            \WCmidangle<180?-1:1,

               arc data pos=0.5,

      data=,

         domain=0:900,

      plot={{#1}:

    {(((#1)*pi/180+15)^2-1)/300

      +(#2)-0.25}},

         radius={0}{0.5},

               slices arrow={1}{0},

       value=sqrt(3+\WCcount*pi*(pi+6)/7)-

    sqrt(3+(\WCcount-1)*pi*(pi+6)/7)

]{                      \exampleforthismanual}

\end{tikzpicture}
\begin{tikzpicture}

\pgfkeys{

  /wheelchart,

     gap,

         radius={1.3}{2},

              start angle=180*(1-2/\WCtotalcount),

        value=1

}

             \wheelchart[

      plot={{#1}:{(#2)*cos(180/\WCtotalcount)/cos(Mod(#1,360/\WCtotalcount)-180/               \WCtotalcount)}}

]{                       \exampleforthismanual}

             \wheelchart[

   at={(8,0)},

                      slices inner arrow={-tan(180/\WCtotalcount)}{0},

                      slices outer arrow={tan(180/\WCtotalcount)}{0}

]{                       \exampleforthismanual}

\end{tikzpicture}
-
/wheelchart/plot style={⟨options⟩} (style, no default, initially empty) 
This key sets inner plot style and outer plot style.
-
/wheelchart/radius={⟨inner radius⟩}{⟨outer radius⟩}(no default) 
This key defines the inner and outer radius of the wheelchart.
-
/wheelchart/samples={⟨number⟩} (no default, initially 25) 
This key determines the ⟨number⟩ of samples used in the plots.
-
/wheelchart/separator columns={⟨delimiter⟩} (no default, initially /) 
-
/wheelchart/separator rows={⟨delimiter⟩} (no default, initially ,) 
The ⟨wheelchart data⟩ in the command \wheelchart is a list in which the items are separated by the value of the key separator rows. Each item in this list corresponds to one slice of the wheelchart and consists of data separated by the value of the key separator columns.
-
/wheelchart/slices={⟨path⟩}(no default) 
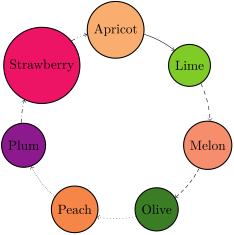
If this key is set then the shape of the slices of the wheelchart is defined by ⟨path⟩.
\begin{tikzpicture}

\def\r{2.5}

%\draw[Red,ultra thick] (0,0) circle[radius=\r];%for comparison

             \wheelchart[

      data=,

               legend entry={

    \draw[->,\WCvarI] let

      \n1={          \WCangle{0.5}{0}{1}{0}},

      \n2={          \WCangle[          \WCcount+1]{0.5}{0}{1}{0}-(\WCcount==\WCtotalcount?360:0)},

      \p1=(WCslice\WCcount.\n1),

      \p2=(WCslice\fpeval{\WCcount=\WCtotalcount?1:\WCcount+1}.\n2),

      \n3={\n1-2*asin(0.5*(veclen(\x1,\y1)/\r cm-1))}

      in (\n3:\r)      arc[            start angle=\n3,end angle={\n2+2*asin(0.5*(veclen(\x2,\y2)/\r cm-1))},       radius=\r];

  },

         radius={0}{\r},

         slices={node[circle,draw,thick,fill=        \WCvarB] (WCslice\WCcount) {        \WCvarC};},

             slices pos=1,

               slices style=,

             start half,

        value=1

]{                       \exampleforthismanual}

\end{tikzpicture}
-
/wheelchart/slices angle pos={⟨value⟩} (no default, initially 0.5) 
-
/wheelchart/slices angle shift={⟨angle⟩} (no default, initially 0) 
These keys determine the position of the slices if the key slices is used similar as the corresponding keys for the key data.
Below we list some keys to modify the shape of the slices. These keys only affect the shape of the slices and not the computation of the inner and outer sides. In particular, these keys do not affect the placement of arc, arc data, data, inner data, lines, wheel data and wheel lines. If this placement should be changed then the keys inner plot and outer plot can be used.
-
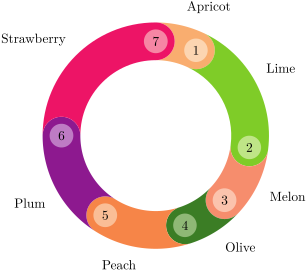
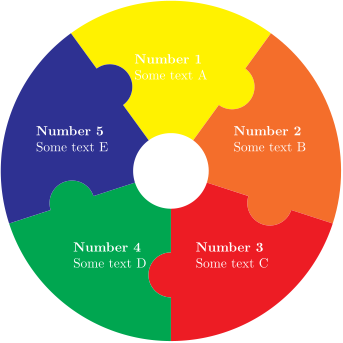
/wheelchart/slices arc={⟨value 1⟩}{⟨value 2⟩}(no default) 
This key sets slices end arc and slices start arc but uses the opposite of ⟨value 1⟩ for slices start arc.
\begin{tikzpicture}

            \wheelchart[

             slices arc={1}{0},

             wheel data=         \WCcount,

                       wheel data angle pos=1,

                 wheel data pos=0.5,

                   wheel data style={

    circle,

    fill=        \WCvarB!50

  }

]{                      \exampleforthismanual}

\end{tikzpicture}
\begin{tikzpicture}

             \wheelchart[

      data=,

         radius={1}{4.5},

             slices arc={1}{0.66},

               slices style=        \WCvarA,

             start half,

        value=1,

             wheel data=

\textbf{Number           \WCcount}\\

            \WCvarB,

                 wheel data pos=0.5,

                    wheel data style=white


]{

  Yellow/Some text A,

  Orange/Some text B,

  Red/Some text C,

  Green/Some text D,

  Blue/Some text E

}

\end{tikzpicture}
-
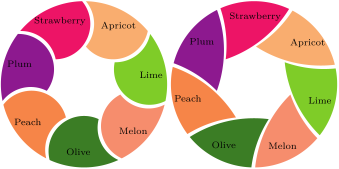
/wheelchart/slices arc inner end=⟨boolean⟩ (default true, initially false) 
If true then the keys slices end arc, slices inner arc and slices start arc are set such that the inner part and the end of each of the slices of the wheelchart form one arc and such that the start has the opposite curvature as the end.
\begin{tikzpicture}[font=\scriptsize]

\foreach\a/\x in {0/0,45/4.5}{

               \wheelchart[

     at={(\x,0)},

        data=,

       gap,

           radius={1}{2.2},

                          slices arc inner end,

                              slices outer angle shift=\a,

          value=1,

               wheel data=        \WCvarC,

                          wheel data angle pos=0.6

  ]{                       \exampleforthismanual}

}

\end{tikzpicture}
-
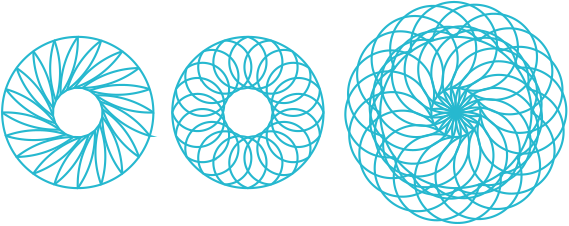
/wheelchart/slices arc inner end start=⟨boolean⟩ (default true, initially false) 
If true then the keys slices end arc, slices inner arc and slices start arc are set such that the inner part and the end of each of the slices of the wheelchart form one arc and such that the start has the same curvature as the end.
\begin{tikzpicture}

\foreach\a/\x in {-60/0,0/4.5,60/10}{

              \wheelchart[

     at={(\x,0)},

           radius={0.66}{2},

                               slices arc inner end start,

                             slices inner angle shift=\a,

                 slices style={fill=none,draw=Turquoise,ultra thick},

                total count=20

  ]{}

}

\end{tikzpicture}
-
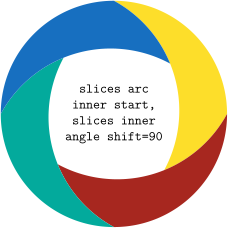
/wheelchart/slices arc inner start=⟨boolean⟩ (default true, initially false) 
If true then the keys slices end arc, slices inner arc and slices start arc are set such that the inner part and the start of each of the slices of the wheelchart form one arc and such that the end has the opposite curvature as the start.
\begin{tikzpicture}

            \wheelchart[

         middle={

                        slices       arc\\

    inner start,\\

                        slices inner\\

    angle shift=90

  },

               middle style={font=\ttfamily},

                         slices arc inner start,

                           slices inner angle shift=90

]{

  1/Goldenrod/,

  1/Mahogany/,

  1/JungleGreen/,

  1/RoyalBlue/

}

\end{tikzpicture}
-
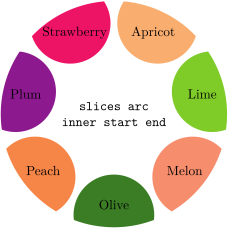
/wheelchart/slices arc inner start end=⟨boolean⟩ (default true, initially false) 
If true then the keys slices end arc, slices inner arc and slices start arc are set such that the inner part and the start of each of the slices of the wheelchart form one arc and such that the end has the same curvature as the start.
\begin{tikzpicture}

             \wheelchart[

      data=,

            gap polar=5,

         middle=

       slices     arc\\

    inner start end,

               middle style={font=\ttfamily},

                              slices arc inner start end,

        value=1,

             wheel data=        \WCvarC,

                 wheel data pos=0.4

]{                       \exampleforthismanual}

\end{tikzpicture}
-
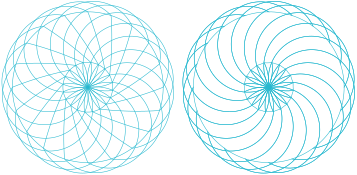
/wheelchart/slices arc match={⟨arg 1⟩}{⟨num 1⟩}{⟨num 2⟩}{⟨num 3⟩}{⟨arg 2⟩}{⟨arg 3⟩}{⟨arg 4⟩}(no default) 
This key modifies the shape of the slices according to the \(7\) arguments.
Here, ⟨arg 1⟩ must be end, inner, outer or start and ⟨arg 2⟩, ⟨arg 3⟩ and ⟨arg 4⟩ must be inner end, inner start, outer end or outer start. For example, the key slices arc inner end sets slices arc match={inner}{1}{-1}{1}{inner end}{inner start}{outer end}.
\begin{tikzpicture}

\foreach\a/\b/\x in

  {end/1/0,inner/-1/4.8}{

              \wheelchart[

     at={(\x,0)},

           radius={0.66}{2},

                     slices arc match=

{\a}{\b}{1}{1}{inner end}

      {inner start}{outer end},

                             slices inner angle shift=60,

                 slices style={

      fill=none,

      draw=Turquoise

    },

                total count=20

  ]{}

}

\end{tikzpicture}
-
/wheelchart/slices arc outer end=⟨boolean⟩ (default true, initially false) 
If true then the keys slices end arc, slices outer arc and slices start arc are set such that the outer part and the end of each of the slices of the wheelchart form one arc and such that the start has the opposite curvature as the end.
-
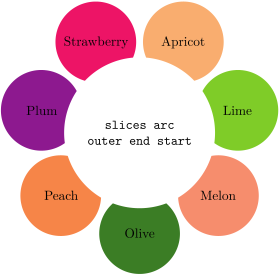
/wheelchart/slices arc outer end start=⟨boolean⟩ (default true, initially false) 
If true then the keys slices end arc, slices outer arc and slices start arc are set such that the outer part and the end of each of the slices of the wheelchart form one arc and such that the start has the same curvature as the end.
\begin{tikzpicture}

             \wheelchart[

      data=,

            gap polar=5,

         middle=

       slices     arc\\

    outer end start,

               middle style={font=\ttfamily},

                              slices arc outer end start,

        value=1,

             wheel data=        \WCvarC

]{                       \exampleforthismanual}

\end{tikzpicture}
-
/wheelchart/slices arc outer start=⟨boolean⟩ (default true, initially false) 
If true then the keys slices end arc, slices outer arc and slices start arc are set such that the outer part and the start of each of the slices of the wheelchart form one arc and such that the end has the opposite curvature as the start.

\begin{tikzpicture}

             \wheelchart[

      data=,

     gap=0.1,

                          slices arc inner start,

                          slices arc outer start,

               slices style={

            \WCvarB!50,

    draw=        \WCvarB,

    ultra thick


  },

        value=1,

             wheel data=          \WCcount,

                 wheel data pos=0.8

]{                       \exampleforthismanual}

\end{tikzpicture}

\begin{tikzpicture}

\foreach\a/\x in {0/0,45/5,90/10}{

              \wheelchart[

     at={(\x,0)},

        data=,

       gap,

          radius={0.66}{2},

                           slices arc outer start,

                             slices outer angle shift=\a,

         value=1

  ]{                      \exampleforthismanual}

}

\end{tikzpicture}
-
/wheelchart/slices arc outer start end=⟨boolean⟩ (default true, initially false) 
If true then the keys slices end arc, slices outer arc and slices start arc are set such that the outer part and the start of each of the slices of the wheelchart form one arc and such that the end has the same curvature as the start.
-
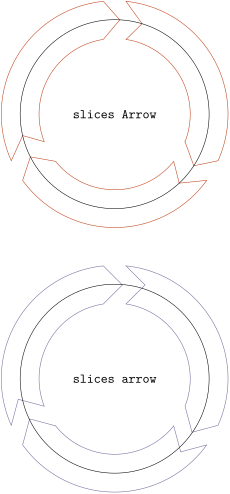
/wheelchart/slices Arrow={⟨angle⟩}(no default) 
This key sets slices end to --(\WCpoint{1}{⟨angle⟩}{0.5}{0})--(\WCpoint{1}{0}{0}{0}) and slices start to --(\WCpoint{0}{⟨angle⟩}{0.5}{0})--cycle.
-
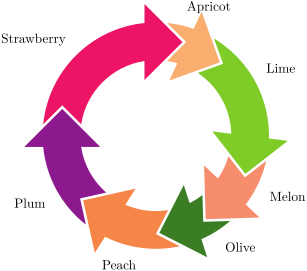
/wheelchart/slices arrow={⟨value 1⟩}{⟨value 2⟩}(no default) 
This key is similar to the key slices arc but draws an arrow.
\begin{tikzpicture}

           \wheelchart[

     gap=0.3,

              slices arrow={1}{-1}

]{                     \exampleforthismanual}

\end{tikzpicture}
The example below compares arrows constructed with the key slices Arrow and the key slices arrow. Using the key slices Arrow, the arrow tip lies on the circle but the line segments do not have the same length. Using the key slices arrow, the arrow tip does not lie on the circle but the line segments have the same length.
\begin{tikzpicture}

            \wheelchart[

      gap=0.3,

         middle=       slices Arrow,

               middle style={font=\ttfamily},

               slices Arrow=10,

               slices style={

    fill=none,

    draw=Bittersweet

  },

              total count=3

]{}

\draw (0,0) circle[       radius=2.5];

            \wheelchart[

   at={(0,-7)},

      gap=0.3,

         middle=       slices arrow,

               middle style={font=\ttfamily},

               slices arrow={1}{0},

               slices style={

    fill=none,

    draw=CadetBlue

  },

              total count=3

]{}

\draw (0,-7) circle[       radius=2.5];

\end{tikzpicture}
-
/wheelchart/slices end={⟨path⟩}(no default) 
This key determines the end of the slice. Initially, this is a line segment from the outer end to the inner end of the slice.
-
/wheelchart/slices end arc={⟨value 1⟩}{⟨value 2⟩}(no default) 
This key determines the end of the slice.
The effect of ⟨value 1⟩ and ⟨value 2⟩ is shown in the figure and the table below.
If \(\text {\meta {value 1}}>0\) then the arc points outwards the slice. If \(\text {\meta {value 1}}<0\) then the arc points inwards the slice. Here, outwards and inwards are relative to the orientation of the four-sided polygon formed by the points whose coordinates are determined by the inner and outer radius of the first slice and the start angle and the angle at the inverse of the key samples between the start angle and the end angle of the first slice. If the start angle and the end angle of the first slice are equal then the end angle of the last slice is used instead. If this test is inconclusive then the orientation is set according to the key counterclockwise.
If \(\text {\meta {value 1}}=0\) then a line segment is drawn.
If ⟨value 1⟩ and ⟨value 2⟩ are negative then an arc is drawn which behaves the same as an arc with
\(\text {\meta {value 2}}=0\) and such that its radius matches the radius of the arc corresponding to setting ⟨value 1⟩ to its opposite. This is illustrated in the table below. 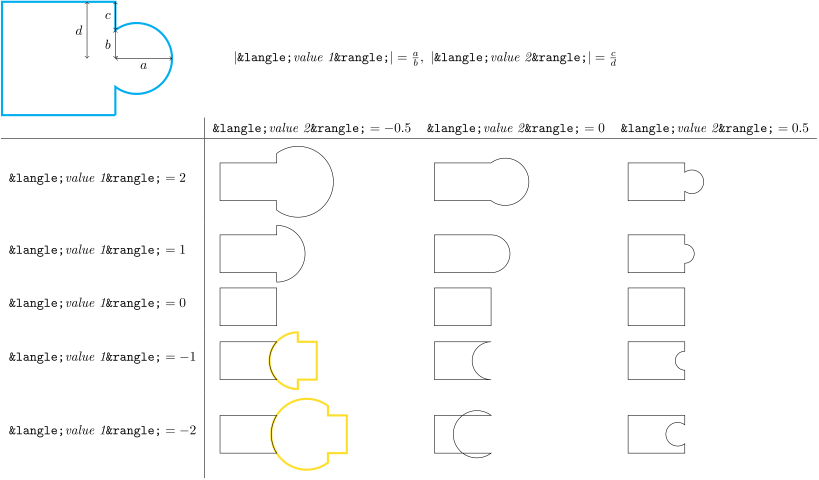

\begin{tikzpicture}

            \wheelchart[

                 for loop start=

\definecolor{WCcolor}{wave}{

      \fpeval{380+(\WCcount-1)*

      340/(\WCtotalcount-1)}

    },

            gap polar=180/              \WCtotalcount,

         radius={1.5}{3},

                 slices end arc={-0.6}{0},

                   slices start arc={1.2}{0},

               slices style=WCcolor,

              total count=20

]{}

\end{tikzpicture}
-
/wheelchart/slices end arrow={⟨value 1⟩}{⟨value 2⟩}(no default) 
This key is similar to the key slices end arc but draws an arrow.
-
/wheelchart/slices end to={⟨value 1⟩}{⟨value 2⟩}(no default) 
This key sets the to path operation for the end of the slice. The angle at the inner side is determined by ⟨value 1⟩ and the angle at the outer side is determined by ⟨value 2⟩.
-
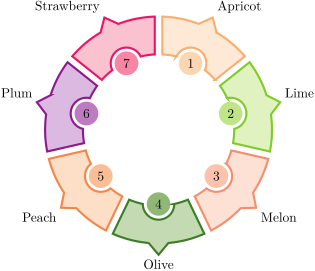
/wheelchart/slices inner={⟨path⟩}(no default) 
This key determines the inner part of the slice. Initially, this is an arc from the inner end to the inner start of the slice.
\begin{tikzpicture}

\def\a{5}

\def\b{12}

             \wheelchart[

           data sep=0.3,

     gap=0.1,

             inner data=          \WCcount,

                 inner data sep=2-2*cos(\b),

                    inner data style={

    circle,

    fill=        \WCvarB!50

  },

               slices inner={

       arc[

                  start angle=          \WCangle{1}{0}{0}{0},

      end angle=          \WCangle{0.5}{\b}{0}{0},

             radius=           \WCradius{0}{0}

    ]

       arc[

                  start angle=\WCmidangle-90,

      end angle=             \WCmidangle+90,

             radius=2*sin(\b)

    ]

       arc[

                  start angle=

          \WCangle{0.5}{-\b}{0}{0},

      end angle=          \WCangle{0}{0}{0}{0},

             radius=           \WCradius{0}{0}

    ]

  },

               slices outer={

       arc[

                  start angle=          \WCangle{0}{0}{1}{0},

      end angle=          \WCangle{0.5}{-\a}{1}{0},

             radius=           \WCradius{1}{0}

    ]

    --(\WCpoint{0.5}{0}{1}{0.3})

    --(\WCpoint{0.5}{\a}{1}{0})

       arc[

                  start angle=

          \WCangle{0.5}{\a}{1}{0},

      end angle=          \WCangle{1}{0}{1}{0},

             radius=           \WCradius{1}{0}

    ]

  },

               slices style={

    draw=        \WCvarB,

    fill=        \WCvarB!25,

    ultra thick


  },

        value=1

]{                       \exampleforthismanual}

\end{tikzpicture}
-
/wheelchart/slices inner angle reduce={⟨angle⟩}(no default) 
This key sets slices inner end angle shift to \(-\text {\meta {angle}}\) and slices inner start angle shift to ⟨angle⟩.
-
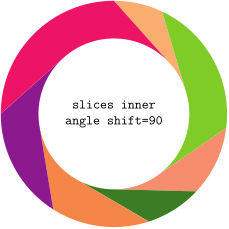
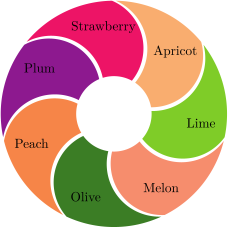
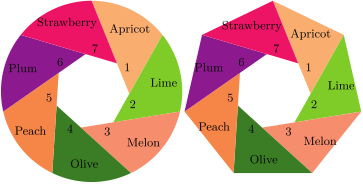
/wheelchart/slices inner angle shift={⟨angle⟩}(no default) 
This key sets slices inner end angle shift and slices inner start angle shift to ⟨angle⟩.
\begin{tikzpicture}

            \wheelchart[

      data=,

         middle={

       slices inner\\

    angle shift=90

  },

               middle style={font=\ttfamily},

                           slices inner angle shift=90

]{                      \exampleforthismanual}

\end{tikzpicture}
\begin{tikzpicture}

             \wheelchart[

      data=,

     gap,

         radius={1}{3},

             slices arc={0.5}{0},

                            slices inner angle shift=45,

        value=1,

             wheel data=        \WCvarC,

                        wheel data angle pos=0.8

]{                       \exampleforthismanual}

\end{tikzpicture}

\begin{tikzpicture}

\foreach\a/\x in {-60/0,0/5.6,60/10}{

              \wheelchart[

     at={(\x,0)},

           radius={0.66}{2},

                           slices arc inner start,

                             slices inner angle shift=\a,

                 slices style={fill=\WClistcolors},

                total count=40,

    WClistcolors={RedOrange,none}

  ]{}

}

\end{tikzpicture}
\begin{tikzpicture}[font=\small]

\pgfkeys{

  /wheelchart,

      data=,

             inner data=          \WCcount,

                 inner data pos=0.1,

                 inner data sep=0,

         radius={1}{2.4},

                            slices inner angle shift=

90-180/               \WCtotalcount,

                    slices inner arc={0}{0},

        value=1,

             wheel data=        \WCvarC

}

             \wheelchart{                       \exampleforthismanual}

             \wheelchart[

   at={(4.8,0)},

                    slices outer arc={0}{0},

                 wheel data pos=0.58

]{                       \exampleforthismanual}

\end{tikzpicture}
-
/wheelchart/slices inner arc={⟨value 1⟩}{⟨value 2⟩}(no default) 
This key is similar to the key slices end arc but sets the inner part of the slice.
-
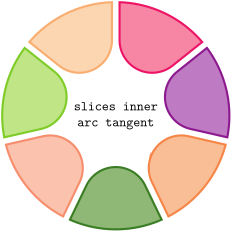
/wheelchart/slices inner arc tangent=⟨boolean⟩ (default true, initially false) 
If true then the key slices inner arc is set such that the arc is tangent to the end and start of the slice if possible. Note that this is not possible for all settings for keys such as plot and slices inner angle shift.
\begin{tikzpicture}

             \wheelchart[

                    counterclockwise,

       data=,

      gap=0.1,

         middle=       slices inner\\arc tangent,

               middle style={font=\ttfamily},

                            slices inner arc tangent,

               slices style={

    draw=        \WCvarB,

    fill=        \WCvarB!50,

    ultra thick


  },

        value=1

]{                       \exampleforthismanual}

\end{tikzpicture}
-
/wheelchart/slices inner arrow={⟨value 1⟩}{⟨value 2⟩}(no default) 
This key is similar to the key slices end arrow but sets the inner part of the slice.

\begin{tikzpicture}

\def\n{10}

           \wheelchart[

        radius={0}{1.5},

                    slices outer arrow={cot(180/\n)}{0},

  slices style{list}={

    BurntOrange,RedOrange


  },

             total count=\n

]{}

           \wheelchart[

        radius={3*cos(180/\n)}{3*cos(180/\n)},

                    slices inner arrow={cot(360/\n)}{0},

                    slices outer arrow={cot(360/\n)}{0},

  slices style{list}={

    Dandelion,Goldenrod


  },

            start half,

             total count=\n

]{}

\end{tikzpicture}
-
/wheelchart/slices inner end angle shift={⟨angle⟩} (no default, initially 0) 
The end angle of the inner part of the slice will be modified such that the angle between the end and the inner part of the slice is shifted with ⟨angle⟩ (taking into account the key counterclockwise). The behavior of this key depends on whether a plot is used.
-
/wheelchart/slices inner start angle shift={⟨angle⟩} (no default, initially 0) 
This key is similar to the key slices inner end angle shift but modifies the start angle of the inner part of the slice.
-
/wheelchart/slices inner to={⟨value 1⟩}{⟨value 2⟩}(no default) 
This key sets the to path operation for the inner part of the slice. The angle at the start is determined by ⟨value 1⟩ and the angle at the end is determined by ⟨value 2⟩.
-
/wheelchart/slices outer={⟨path⟩}(no default) 
This key determines the outer part of the slice. Initially, this is an arc from the outer start to the outer end of the slice.
-
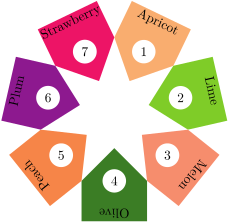
/wheelchart/slices outer angle reduce={⟨angle⟩}(no default) 
This key sets slices outer end angle shift to \(-\text {\meta {angle}}\) and slices outer start angle shift to ⟨angle⟩.
\begin{tikzpicture}

             \wheelchart[

      data=,

             inner data=          \WCcount,

                    inner data style={

    circle,

    fill=white

  },

                      slices inner arrow={1}{0},

                             slices outer angle reduce=

180/               \WCtotalcount,

                      slices outer arrow={0}{0},

        value=1,

             wheel data=        \WCvarC,

                    wheel data style={

    rotate=\WCmidangle-90

  }

]{                       \exampleforthismanual}

\end{tikzpicture}
-
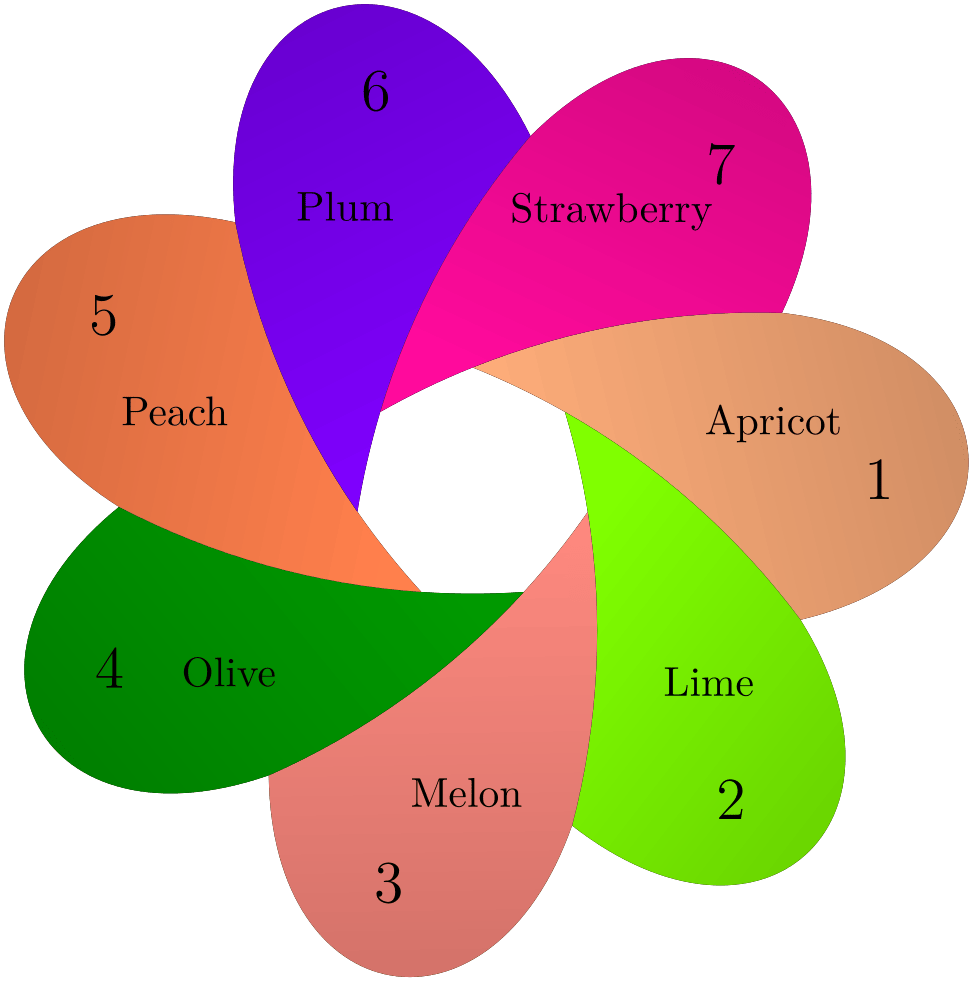
/wheelchart/slices outer angle shift={⟨angle⟩}(no default) 
This key sets slices outer end angle shift and slices outer start angle shift to ⟨angle⟩.
\begin{tikzpicture}[looseness=2]

             \wheelchart[

      data=,

             inner data=\Large          \WCcount,

                 inner data pos=1.1,

         radius={1}{3},

                        slices arc inner end,

                            slices outer angle shift=80,

                  slices outer to={80}{80},

               slices style={

    bottom color=        \WCvarB,

    top color=        \WCvarB!80!black,

    shading angle=\WCmidangle-90

  },

        value=1,

             wheel data=        \WCvarC,

                        wheel data angle pos=0.4,

                 wheel data pos=0.8

]{                       \exampleforthismanual}

\end{tikzpicture}
-
/wheelchart/slices outer arc={⟨value 1⟩}{⟨value 2⟩}(no default) 
This key is similar to the key slices end arc but sets the outer part of the slice.
-
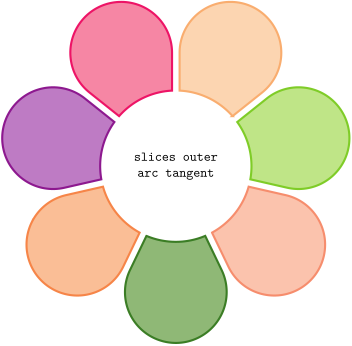
/wheelchart/slices outer arc tangent=⟨boolean⟩ (default true, initially false) 
If true then the key slices outer arc is set such that the arc is tangent to the end and start of the slice if possible. Note that this is not possible for all settings for keys such as plot and slices inner angle shift.
\begin{tikzpicture}

             \wheelchart[

       data=,

      gap=0.1,

         middle=       slices outer\\arc tangent,

               middle style={font=\ttfamily},

                            slices outer arc tangent,

               slices style={

    draw=        \WCvarB,

    fill=        \WCvarB!50,

    ultra thick


  },

        value=1

]{                       \exampleforthismanual}

\end{tikzpicture}
-
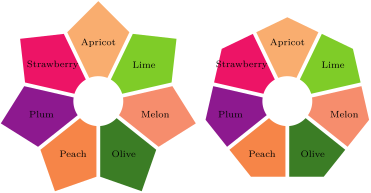
/wheelchart/slices outer arrow={⟨value 1⟩}{⟨value 2⟩}(no default) 
This key is similar to the key slices end arrow but sets the outer part of the slice.
\begin{tikzpicture}[font=\scriptsize]

\foreach\a/\x in

  {1/0,{tan(180/\WCtotalcount)}/5}{

               \wheelchart[

     at={(\x,0)},

        data=,

       gap,

           radius={0.66}{2},

                        slices outer arrow={\a}{0},

               start half,

          value=1,

               wheel data=        \WCvarC

  ]{                       \exampleforthismanual}

}

\end{tikzpicture}

\begin{tikzpicture}

\pgfkeys{

  /wheelchart,

      data=,

        radius={1}{1.5},

       value=1

}

            \wheelchart[

                     slices inner arrow={0}{0}

]{                      \exampleforthismanual}

            \wheelchart[

   at={(3.25,0)},

                     slices outer arrow={0}{0}

]{                      \exampleforthismanual}

            \wheelchart[

   at={(6.5,0)},

                     slices inner arrow={0}{0},

                     slices outer arrow={0}{0}

]{                      \exampleforthismanual}

\end{tikzpicture}
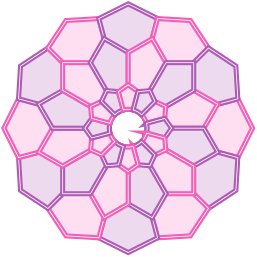
\begin{tikzpicture}

\foreach\r/\s/\a in

  {3/0/0.5,2/15/1,1/30/0.7}{

              \wheelchart[

           radius={0.5}{\r},

                       slices outer arrow={\a}{0},

                 slices style={

      fill=\WClistcolors!20,

      draw=\WClistcolors,

      ultra thick,

      double


    },

               start half=\s,

                total count=12,

    WClistcolors={CarnationPink,Orchid}

  ]{}

}

\end{tikzpicture}
-
/wheelchart/slices outer end angle shift={⟨angle⟩} (no default, initially 0) 
The end angle of the outer part of the slice will be modified such that the angle between the end and the inner (not the outer) part of the slice is shifted with ⟨angle⟩ (taking into account the key counterclockwise). The behavior of this key depends on whether a plot is used.
-
/wheelchart/slices outer start angle shift={⟨angle⟩} (no default, initially 0) 
This key is similar to the key slices outer end angle shift but modifies the start angle of the outer part of the slice.
-
/wheelchart/slices outer to={⟨value 1⟩}{⟨value 2⟩}(no default) 
This key sets the to path operation for the outer part of the slice. The angle at the start is determined by ⟨value 1⟩ and the angle at the end is determined by ⟨value 2⟩.
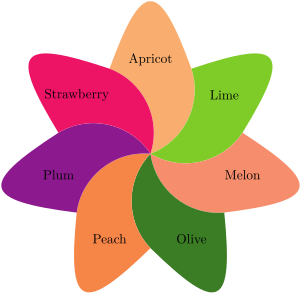
\begin{tikzpicture}[looseness=3]

             \wheelchart[

      data=,

         radius={0}{2.5},

             slices arc={0.4}{0},

                  slices outer to={70}{70},

             start half,

        value=1,

             wheel data=        \WCvarC,

                 wheel data pos=1

]{                       \exampleforthismanual}

\end{tikzpicture}
-
/wheelchart/slices pos={⟨value⟩} (no default, initially 0.5) 
This key determines the position of the slices if the key slices is used similar as the corresponding key for the key data.
-
/wheelchart/slices scope={⟨options⟩} (style, no default, initially empty) 
This key accepts a list of keys which will be applied to the scope in which the slices of the wheelchart, the wheel lines determined by the key wheel lines and the different kinds of data are placed.
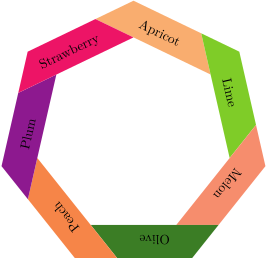
\begin{tikzpicture}

             \wheelchart[

      data=,

         radius={3.9}{4.5},

                    slices inner arc={0}{0},

                             slices outer angle reduce=5*90/7,

                    slices outer arc={0}{0},

               slices scope={

    shift={

      ($(90+\WCmidangle:0.559572)

      +(             \WCmidangle:-1.16196)$)

    }

  },

        value=1,

             wheel data=        \WCvarC,

                 wheel data pos=0,

                    wheel data style={

    rotate=\WCmidangle-90

  }

]{                       \exampleforthismanual}

\end{tikzpicture}
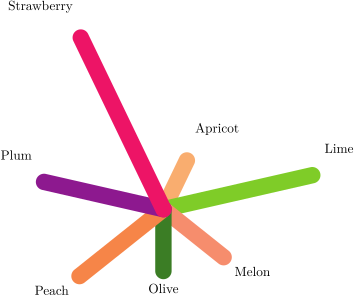
\usepackage {siunitx}

\begin{tikzpicture}

            \wheelchart[

      data=

        \WCvarC\\

    \qty{\fpeval{        \WCvarA/2}}{\percent},

         radius={0.5}{0.5+0.1*        \WCvarA},

                           slices inner arc tangent,

                            slices outer angle reduce=

180/              \WCtotalcount,

                           slices outer arc tangent,

               slices scope={shift={(            \WCmidangle:

{-cos(180/\WCtotalcount)/2})}},

       value=1

]{                      \exampleforthismanual}

\end{tikzpicture}
-
/wheelchart/slices sep={⟨value⟩} (no default, initially 0) 
This key determines the position of the slices if the key slices is used similar as the corresponding key for the key data.
-
/wheelchart/slices start={⟨path⟩}(no default) 
This key determines the start of the slice. Initially, this is a line segment from the inner start to the outer start of the slice.
-
/wheelchart/slices start arc={⟨value 1⟩}{⟨value 2⟩}(no default) 
This key is similar to the key slices end arc but sets the start of the slice.
-
/wheelchart/slices start arrow={⟨value 1⟩}{⟨value 2⟩}(no default) 
This key is similar to the key slices end arrow but sets the start of the slice.
-
/wheelchart/slices start to={⟨value 1⟩}{⟨value 2⟩}(no default) 
This key sets the to path operation for the start of the slice. The angle at the inner side is determined by ⟨value 1⟩ and the angle at the outer side is determined by ⟨value 2⟩.
-
/wheelchart/slices style={⟨options⟩} (style, no default, initially \WCvarB) 
This key defines the style of the slices of the wheelchart.
-
/wheelchart/slices to={⟨value 1⟩}{⟨value 2⟩}(no default) 
This key sets slices end to and slices start to but uses the opposite respective values for slices start to.

\begin{tikzpicture}[looseness=2]

           \wheelchart[

        radius={1}{3},

                          slices inner angle shift=90,

                  slices inner arc={0}{0},

                 slices outer to={70}{70},

  slices style{list}={Maroon,Salmon},

           slices to={30}{30},

             total count=6

]{}

\end{tikzpicture}
-
/wheelchart/slice{⟨range⟩}={⟨options⟩} (style, no default, initially empty) 
This key accepts a list of keys from the wheelchart key family. The ⟨range⟩ is mandatory and must be non-empty. It is processed with \foreach with the option parse=true. Hereafter the elements are processed with \fp_eval:n. The ⟨options⟩ will only be applied to a slice if the number of the slice is in the ⟨range⟩. The ⟨range⟩ only makes sense for a key which is processed for each slice. For example, the ⟨range⟩ does not make sense for the key middle.
-
/wheelchart/start angle={⟨angle⟩} (no default, initially 90) 
This key defines the ⟨angle⟩ in degrees at which the first slice of the wheelchart starts.
-
/wheelchart/start half={⟨angle⟩} (default 90) 
This key sets the start angle such that the middle of the first slice of the wheelchart is positioned at ⟨angle⟩ in degrees.
-
/wheelchart/title={⟨text⟩} (no default, initially empty) 
This key contains the ⟨text⟩ which will be placed above the wheelchart. The ⟨text⟩ is placed in a node. The \(x\) coordinate of this node is the \(x\) coordinate of the center of the wheelchart, which is defined by the key at. In general, this is not the same as the \(x\) coordinate of the center of the local bounding box around the wheelchart. The \(y\) coordinate of this node is at a value determined by the key title sep above the north of the local bounding box around the wheelchart. The style of this node is given as follows. First, the options anchor=south,align=center are given. Thereafter, the style of the key title style is added.
-
/wheelchart/title left={⟨text⟩} (no default, initially empty) 
This key contains the ⟨text⟩ which will be placed above left of the wheelchart. The ⟨text⟩ is placed in a node. This node is placed at a value determined by the key title left sep above the north west of the local bounding box around the wheelchart. The style of this node is given as follows. First, the options anchor=south west,align=left are given. Thereafter, the style of the key title left style is added.
-
/wheelchart/title left sep={⟨value⟩} (no default, initially 0.5) 
The node where the contents of the key title left is placed is at ⟨value⟩ above the north west of the local bounding box around the wheelchart.
-
/wheelchart/title left style={⟨options⟩} (style, no default, initially empty) 
This key accepts a list of keys which will be applied to the node where the contents of the key title left is placed.
-
/wheelchart/title sep={⟨value⟩} (no default, initially 0.5) 
The \(y\) coordinate of the node where the contents of the key title is placed is at ⟨value⟩ above the north of the local bounding box around the wheelchart.
-
/wheelchart/title style={⟨options⟩} (style, no default, initially empty) 
This key accepts a list of keys which will be applied to the node where the contents of the key title is placed.
-
/wheelchart/total angle={⟨angle⟩} (no default, initially 360) 
This key defines the total ⟨angle⟩ in degrees of the wheelchart.
-
/wheelchart/total count={⟨number⟩}(no default) 
If this key is set then the number of slices of the wheelchart is determined by ⟨number⟩. Moreover, \WCvarA is defined as 1 and \WCvarB and \WCvarC are defined to be empty.
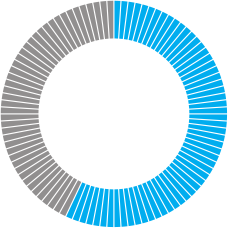
\usepackage {siunitx}

\begin{tikzpicture}

\def\n{57}

            \wheelchart[

     gap=0.015,

         middle=\Huge\qty{\n}{\percent},

               slices style=Gray,

  slices style{1,...,\n}=Cyan,

              total count=100

]{}

\end{tikzpicture}
-
/wheelchart/triangle proportional area={⟨width⟩}{⟨height⟩}(no default) 
This key configures the plot such that a triangular shape is obtained. The value is proportional to the area and not to the height. Moreover, it sets samples=2 and wheel data pos=0.5. The point \((0,0)\) is at the top. This can be shifted with the key at.
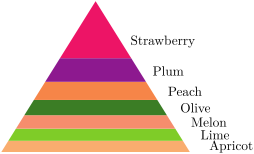
\begin{tikzpicture}

            \wheelchart[

                             triangle proportional area={5}{4},

       value=1

]{                      \exampleforthismanual}

\end{tikzpicture}
-
/wheelchart/triangle proportional height={⟨width⟩}{⟨height⟩}(no default) 
This key configures the plot such that a triangular shape is obtained. The value is proportional to the height and not to the area. Moreover, it sets samples=2 and wheel data pos=0.5. The point \((0,0)\) is at the top. This can be shifted with the key at.
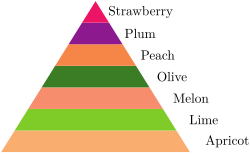
\begin{tikzpicture}

            \wheelchart[

                               triangle proportional height={5}{4},

       value=1

]{                      \exampleforthismanual}

\end{tikzpicture}
-
/wheelchart/value={⟨value⟩} (no default, initially \WCvarA) 
This key defines the ⟨value⟩ which corresponds to the size of each slice of the wheelchart.
-
/wheelchart/WClist⟨name⟩={⟨list⟩}(no default) 
This key locally defines a macro \WClist⟨name⟩ which gives the element in the ⟨list⟩ with as index \WCcount modulo the length of the ⟨list⟩. The ⟨list⟩ is expanded once and processed using a clist. In particular, blank arguments are ignored. An empty argument in the ⟨list⟩ can be obtained with {}. Items containing a , can be obtained by surrounding it with { and } such as WClistA={{a,b},{c,d}}.
If \def\mylist{a,b,c} and WClistA=\mylist then \WClistA gives a,b,c for each slice. On the other hand, if WClistA/.expanded=\mylist then \WClistA alternates between a, b and c.
-
/wheelchart/wheel data={⟨text⟩} (no default, initially empty) 
This key contains the ⟨text⟩ which will be placed on top of each slice of the wheelchart. The ⟨text⟩ is placed in a node. The style of this node is given as follows. First, the option align=left is given. Thereafter, the style of the key wheel data style is added.
-
/wheelchart/wheel data angle pos={⟨value⟩} (no default, initially 0.5) 
-
/wheelchart/wheel data angle shift={⟨angle⟩} (no default, initially 0) 
-
/wheelchart/wheel data pos={⟨value⟩} (no default, initially 0.66) 
-
/wheelchart/wheel data sep={⟨value⟩} (no default, initially 0) 
These keys determine the position of the contents of the key wheel data similar as the corresponding keys for the key data.
-
/wheelchart/wheel data style={⟨options⟩} (style, no default, initially empty) 
This key accepts a list of keys which will be applied to the node where the contents of the key wheel data is placed.
-
/wheelchart/wheel lines={⟨options⟩} (style, no default, initially empty) 
If this key is set then lines with the style determined by this key will be drawn inside the slices of the wheelchart. The number of these lines depends on the value of the key value.
Below is the example from [5, Subsection 7.6] recreated with the package wheelchart.
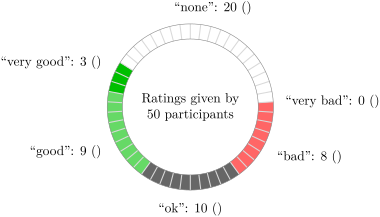
\usepackage {siunitx}

\begin{tikzpicture}

\colorlet{good}{green!75!black}

\colorlet{bad}{red}

\colorlet{neutral}{black!60}

\colorlet{none}{white}

           \wheelchart[

             anchor xsep=15,

         contour=gray,

      data=``       \WCvarC'':        \WCvarA{} (\WCperc),

        middle=Ratings given by\\           \WCtotalnum{} participants,

        radius={1.8}{2.2},

            start half=270,

             wheel lines={black!15,thick}

]{

  10/neutral/ok,

  9/good!60!white/good,

  3/good/very good,

  20/none/none,

  0/bad/very bad,

  8/bad!60!white/bad

}

\end{tikzpicture}
-
/wheelchart/xbar={⟨width⟩}{⟨height⟩}(no default) 
This key sets domain=0:{⟨width⟩}, plot={{#1},{#2}}, radius={0}{⟨height⟩}, samples=2 and also wheel data pos=0.5. The point \((0,0)\) is below left of the bar. This can be shifted with the key at. Note that since this key sets in particular the outer parts of the slices, keys such as slices outer arc must be placed after the key xbar to be applied.

\begin{tikzpicture}

           \wheelchart[

  data pos{list}={1,0},

            data style={anchor=mid},

           gap polar=0.05,

              slices arrow={1}{0},

      xbar={8}{1.5}

]{                     \exampleforthismanual}

\end{tikzpicture}
-
/wheelchart/ybar={⟨width⟩}{⟨height⟩}(no default) 
This key sets domain=0:{⟨height⟩}, plot={{#2},{#1}}, radius={0}{⟨width⟩}, samples=2 and also wheel data pos=0.5. The point \((0,0)\) is below left of the bar. This can be shifted with the key at.
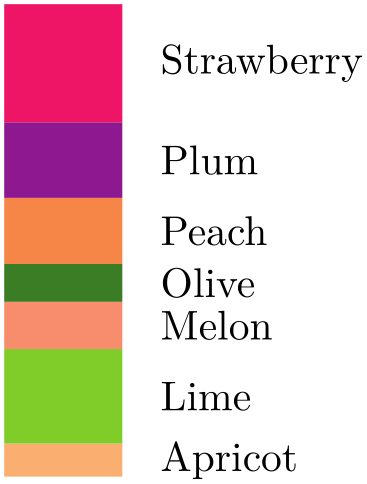
\begin{tikzpicture}

           \wheelchart[

            inner data=       \WCperc,

                  inner data style=left,

      ybar={1}{4}

]{                     \exampleforthismanual}

\end{tikzpicture}