TikZ and PGF Manual
Part VI Data Visualization
Sections
by Till Tantau
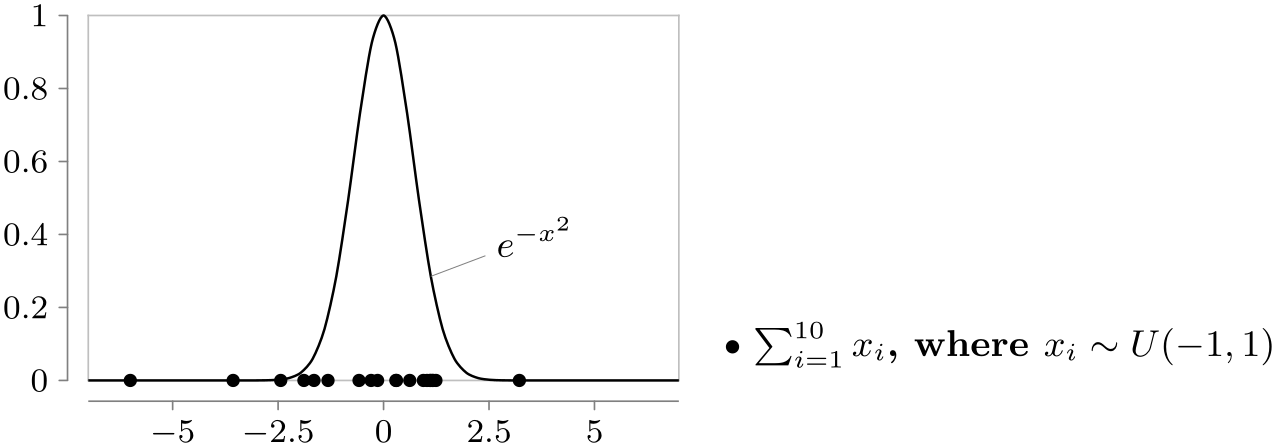
                \usetikzlibrary {datavisualization.formats.functions}

                \tikz \datavisualization [scientific axes=clean]

                [

                  visualize as smooth line=Gaussian,

                  Gaussian={pin in data={text={$e^{-x^2}$},when=x is 1}}
 ]

                data [format=function] {

                  var
                x
                :
                interval [-7:7] samples
                51;

                  func
                y
                = exp(-\value x*\value x);

                }

                [

                  visualize as scatter,

                  legend={south east outside},

                  scatter={

                      style={mark=*,mark size=1.4pt},

                      label
                  in legend={text={

                          $\sum_{i=1}^{10} x_i$, where $x_i \sim U(-1,1) $}}}
 ]

                data [format=function] {

                  var
                i
                :
                interval [0:1] samples
                20;

                  func
                y
                = 0;

                  func
                x
                =
                (rand + rand + rand + rand + rand +

                  rand + rand + rand + rand + rand);

                };
