TikZ and PGF Manual
Part IX The Basic Layer
Sections
- Design Principles
- Hierarchical Structures: Package, Environments, Scopes, and Text
- Specifying Coordinates
- Constructing Paths
- Decorations
- Using Paths
- Defining New Arrow Tip Kinds
- Nodes and Shapes
- Matrices
- Coordinate, Canvas, and Nonlinear Transformations
- Patterns
- Declaring and Using Images
- Externalizing Graphics
- Creating Plots
- Layered Graphics
- Shadings
- Transparency
- Animations
- Adding libraries to pgf: temporary registers
- Quick Commands
by Till Tantau
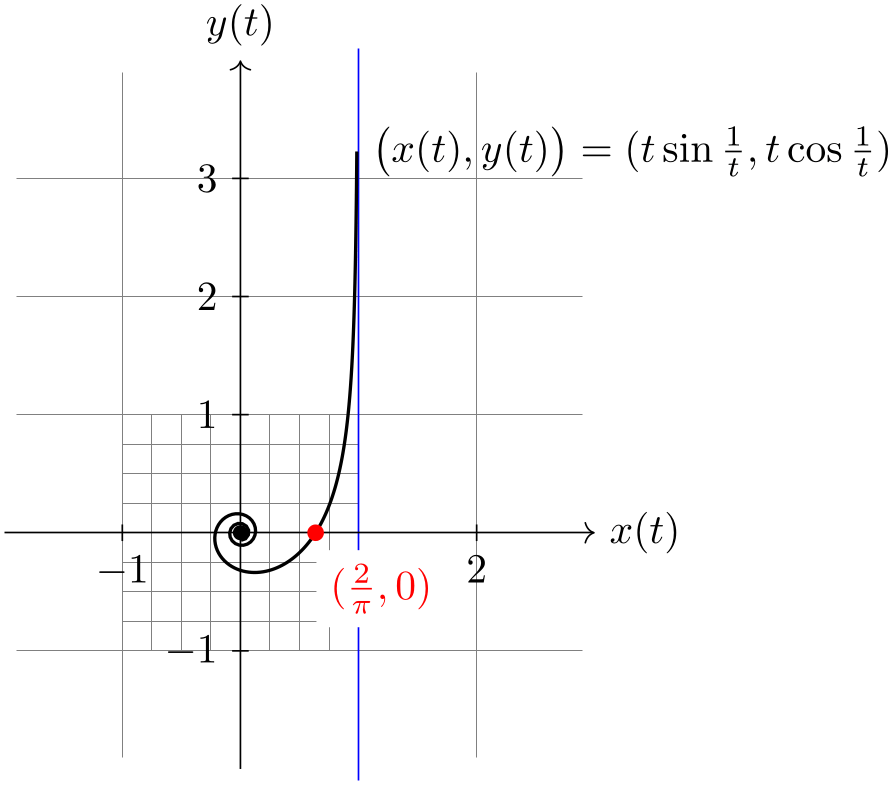
                \begin{tikzpicture}

                  \draw[gray,very thin] (-1.9,-1.9) grid
                (2.9,3.9)

                          [step=0.25cm] (-1,-1) grid
                (1,1);

                  \draw[blue] (1,-2.1) --
                (1,4.1); % asymptote


                  \draw[->] (-2,0) --
                (3,0) node[right] {$x(t)$};

                  \draw[->] (0,-2) --
                (0,4) node[above] {$y(t)$};


                  \foreach \pos in
                {-1,2}

                    \draw[shift={(\pos,0)}] (0pt,2pt) --
                (0pt,-2pt) node[below] {$\pos$};


                  \foreach \pos in
                {-1,1,2,3}

                    \draw[shift={(0,\pos)}] (2pt,0pt) --
                (-2pt,0pt) node[left] {$\pos$};


                  \fill (0,0) circle
                (0.064cm);

                  \draw[thick,parametric,domain=0.4:1.5,samples=200]

                    % The plot is reparameterised such that there are more samples

                    % near the center.

                    plot[id=asymptotic-example] function{(t*t*t)*sin(1/(t*t*t)),(t*t*t)*cos(1/(t*t*t))}

                    node[right] {$\bigl(x(t),y(t)\bigr) =
                (t\sin \frac{1}{t}, t\cos \frac{1}{t})$};


                  \fill[red] (0.63662,0) circle
                (2pt)

                    node
                [below right,fill=white,yshift=-4pt] {$(\frac{2}{\pi},0)$};

                \end{tikzpicture}