Manual for Package pgfplots
2D/3D Plots in LATeX, Version 1.18.2
https://github.com/pgf-tikz/pgfplots
PGFplotsTable
6.2From Input Data To Output Tables: Data Processing
The conversion from an unprocessed input table to a final typesetted tabular code uses four stages for every cell,
-
1. Loading the table,
-
2. Preprocessing,
-
3. Typesetting,
-
4. Postprocessing.
The main idea is to select one typesetting algorithm (for example “format my numbers with the configured number style”). This algorithm usually doesn’t need to be changed. Fine-tuning can then be done using zero, one or more preprocessors and postprocessors. Preprocessing can mean to select only particular rows or to apply some sort of operation before the typesetting algorithm sees the content. Postprocessing means to apply fine-tuning to the resulting TeX output – for example to deal with empty cells or to insert unit suffixes or modify fonts for single cells.
Note that this kind of operation is processed column by column. As a consequence, the keys for preprocessing, typesetting, and postprocessing apply to styles on columns. They are unavailable for row styles like every last row. If you need to apply such content-based operations on specific rows, you have to write code of sorts “if \pgfplotstablerow \(=\) generate content differently”.
6.2.1Loading the table
This first step to typeset a table involves the obvious input operations. Furthermore, the “new column creation” operations explained in Section 6.3 are processed at this time. The table data is read (or acquired) as already explained earlier in this manual. Then, if columns are missing, column alias and create on use specifications will be processed as part of the loading procedure. See Section 6.3 for details about column creation.
6.2.2Typesetting Cell Content
Typesetting cells means to take their value and “do something”. In many cases, this involves number formatting routines. For example, the “raw” input data 12.56 might become 1.26 \cdot 10^1. The result of this stage is no longer useful for content-based computations. The typesetting step follows the preprocessing step.
Typesetting cell content is applied in a column by column fashion, i.e. it can be configured for row styles. See the notes in the introduction of Section 6.2 for details how to apply such styles on specific rows only.


Allows to redefine the algorithm which assigns cell contents. The argument #1 is the (unformatted) contents of the input table.
The resulting output needs to be written to /pgfplots/table/@cell content.
% An example how to use
% \usepackage{multirow} and
% \usepackage{booktabs}:
\pgfplotstabletypeset[
columns/Z/.style={
column name={},
assign cell content/.code={% use \multirow for Z column:
\ifnum\pgfplotstablerow=0
                                    \pgfkeyssetvalue{/pgfplots/table/@cell
                    content}
{\multirow{4}{*}{##1}}%
\else
                                    \pgfkeyssetvalue{/pgfplots/table/@cell
                    content}{}%
\fi
},
},
% use \booktabs as well (compare examples above):
every head row/.style={before row=\toprule,after row=\midrule},
every last row/.style={after row=\bottomrule},
row sep=\\,col sep=&,
outfile=pgfplotstable.multirow.out,% write it to file
]{% here: inline data in tabular format:
Z & a & b \\
data & 1 & 2 \\
& 3 & 4 \\
& 5 & 6 \\
& 7 & 8 \\
}
% ... and show the generated file:
\lstinputlisting[basicstyle=\footnotesize\ttfamily]{pgfplotstable.multirow.out}
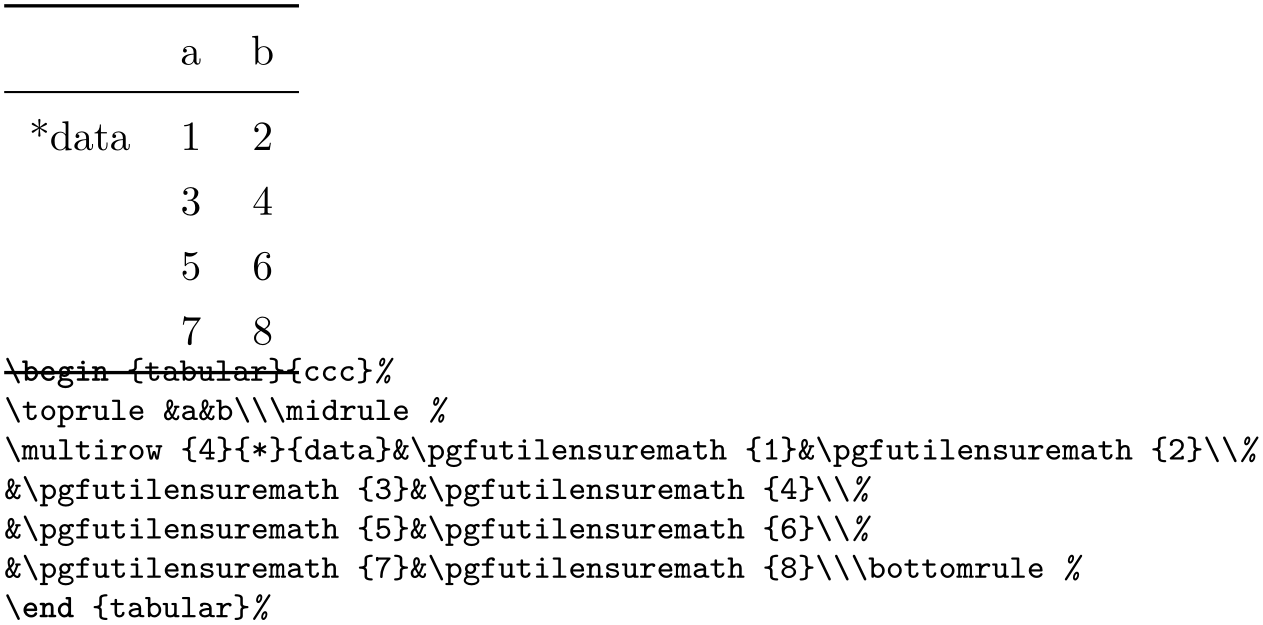
The example above uses \usepackage{multirow} to format column Z. More precisely, it uses \multirow{4}{*}{data} for row #0 of column Z and the empty string for any other row in column Z.
Please note that you may need special attention for #1={
 }, i.e. the empty string. This may happen if a column has less rows than the first column.
PgfplotsTable will balance columns automatically in this case, inserting enough empty cells to
match the number of rows of the first column.
}, i.e. the empty string. This may happen if a column has less rows than the first column.
PgfplotsTable will balance columns automatically in this case, inserting enough empty cells to
match the number of rows of the first column.
Please note further that if any column has more entries than the first column, these entries will be skipped and a warning message will be issued into the logfile.
This key is evaluated inside of a local TeX group, so any local macro assignments will be cleared afterwards.
-
/pgfplots/table/numeric type(style, no value) 
A style which (re)defines assign cell content back to its original value which assumes numerical data.
It invokes \pgfmathprintnumberto and writes the result into @cell content.
-
/pgfplots/table/string type(style, no value) 
A style which redefines assign cell content to simply return the “raw” input data, that means as text column. This assumes input tables with valid LaTeX content (verbatim printing is not supported).
-
/pgfplots/table/verb string type(style, no value) 
A style which redefines assign cell content to return the “raw” as is. Thus, it is quite similar to string type – but it will return control sequences and (many, not all) special characters without expanding them.
You may need to combine verb string type with special chars.
-
/pgfplots/table/numeric as string type(style, no value) 
A style which redefines assign cell content such that it assumes numerical input data. It returns a string literal describing the input number either as integer or in scientific (exponential) notation. In contrast to numeric type, it does not apply number formatting.
-
/pgfplots/table/date type={
date format}
-
\monthname 
-
\monthshortname 
-
\weekday 
-
\weekdayname 
-
\weekdayshortname 
A style which expects ISO
dates of the form YYYY-MM-DD in each cell and produces pretty-printed strings on output. The output format is
given as
date format. Inside of
date format, several macros which are explained below can be used.
% Requires
% \usepackage{pgfcalendar}
\pgfplotstableset{columns={date,account1}}
% plotdata/accounts.dat contains:
%
% date account1 account2 account3
% 2008-01-03 60 1200 400
% 2008-02-06 120 1600 410
% 2008-03-15 -10 1600 410
% 2008-04-01 1800 500 410
% 2008-05-20 2300 500 410
% 2008-06-15 800 1920 410
% Show the contents in `string type':
\pgfplotstabletypeset[
columns/date/.style={string type}
]{plotdata/accounts.dat}
\hspace{1cm}
% Show the contents in `date type':
\pgfplotstabletypeset[
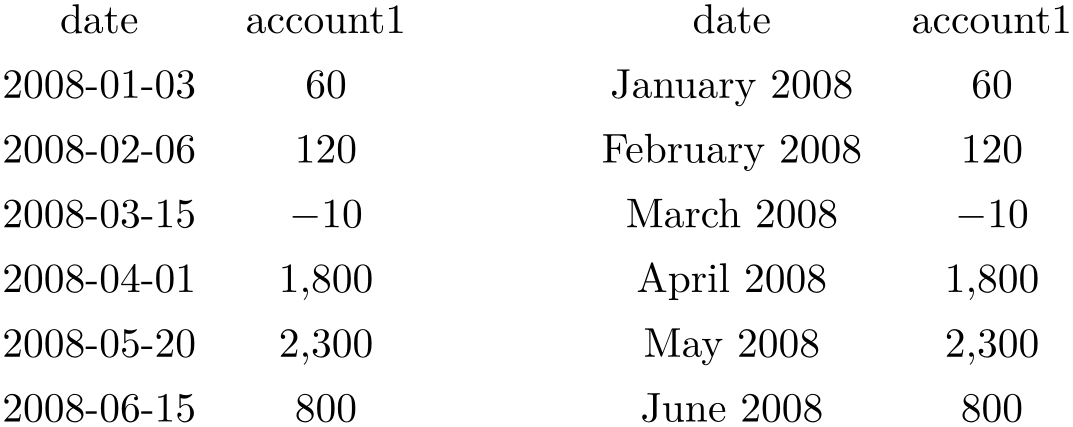
columns/date/.style={date type={\monthname\ \year}}
]{plotdata/accounts.dat}
This style requires to load the pgf calendar package:
\usepackage{pgfcalendar}
Inside of
date format, this macro expands to the month’s name as set in the current language (like January). See below for
how to change the language.
Inside of
date format, this macro expands to the month’s short name as set in the current language (like Jan). See below
for how to change the language.
Inside of
date format, this macro expands to the weekday number (\(0\) for Monday, \(1\) for Tuesday etc.).
Inside of
date format, this macro expands to the weekday’s name in the current language (like Wednesday). See below for how
to change the language.
Inside of
date format, this macro expands to the weekday’s short name in the current language (like Wed). See below for how
to change the language.
Changing the language for dates
The date feature is implemented using the pgf calendar module. This module employs the package translator (if it is loaded). I don’t have more details yet, sorry. Please refer to the PGF/TikZ manual for more details.
6.2.3Preprocessing Cell Content
The preprocessing step allows to change cell contents before any typesetting routine (like number formatting) has been applied. Thus, if tables contain numerical data, it is possible to apply math operations at this stage. Furthermore, cells can be erased depending on their numerical value. The preprocessing step follows after the data acquisition step (“loading step”). This means in particular that you can create (or copy) columns and apply operations on them.
Preprocessing is applied in a column by column fashion, i.e. it can be configured for row styles. See the notes in the introduction of Section 6.2 for details how to apply such styles on specific rows only.
Allows to modify the contents of cells before assign cell content is called.
The semantics is as follows: before the preprocessor, @cell content contains the raw input data (or, maybe, the result of another preprocessor call). After the preprocessor, @cell content is filled with a – possibly modified – value. The resulting value is then used as input to assign cell content.
In the default settings, assign cell content expects numerical input. So, the preprocessor is expected to produce numerical output.
It is possible to provide multiple preprocessor directives using /.append code or /.append style key handlers.
In case you don’t want (or need) stackable preprocessors, you can also use ‘#1’ to get the raw input datum as it is found in the file. Furthermore, the key @unprocessed cell content will also contain the raw input datum.
-
/pgfplots/table/string replace={
cell match}{cell replacement}
Appends code to the
current
preproc cell content value
which replaces any cell with exact match
cell match
by
cell replacement. No expansion is performed during this step;
cell match
must match literally.
\pgfplotstabletypeset[columns={level,dof}]
{pgfplotstable.example1.dat}
\pgfplotstabletypeset[
columns={level,dof},
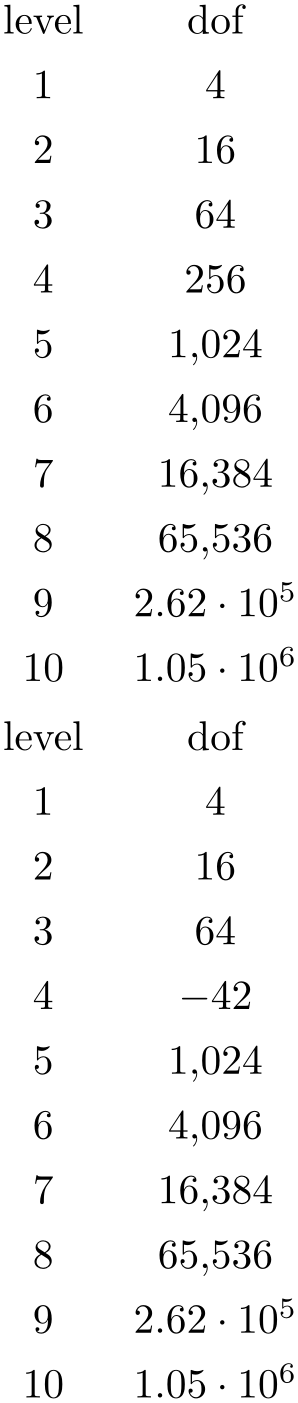
columns/level/.style={string replace={A}{B}}, % does nothing because there is no cell 'A'
columns/dof/.style={string replace={256}{-42}}] % replace cell '256' with '-42'
{pgfplotstable.example1.dat}
See the string replace* method for sub-string replacement.
-
/pgfplots/table/string replace*={
pattern}{replacement}
Appends code to the
current
preproc cell content value
which replaces every occurrence of
pattern
with
replacement. No expansion is performed during this step;
pattern
must match literally.
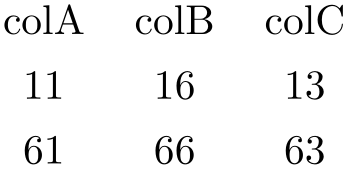
\pgfplotstabletypeset[
string replace*={2}{6},
col sep=&,row sep=\\]{
colA & colB & colC \\
11 & 12 & 13 \\
21 & 22 & 23 \\
}
-
/pgfplots/table/clear infinite(style, no value) 
Appends code to the current preproc cell content value which replaces every infinite number with the empty string. This clears any cells with \(\pm \infty \) and NaN.
-
/pgfplots/table/preproc/expr={
math expression}
-
• The string ‘##1’ expands to the cell’s content as it has been found in the input file, ignoring preceding preprocessors.
This is usually enough.
-
• The command \thisrow{
the currently processed column name} expands to the current cell’s content. This will also include the results of preceding preprocessors.
Note that \thisrow{} in this context (inside of the preprocessor) is not as powerful as in the context of column creation routines: the argument must match exactly the name of the currently processed column name. You can also use the shorthand
-
• The command \pgfkeysvalueof{/pgfplots/table/@cell content} is the same.
Appends code to the
current
preproc cell content value
which evaluates
math expression
for every cell. Arithmetics are carried out in floating point.
Inside of
math expression, use one of the following expressions to get the current cell’s value.
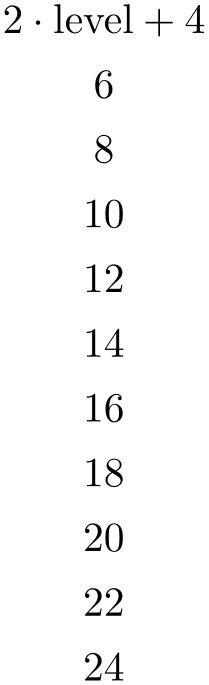
\pgfplotstabletypeset[
columns={level},
columns/level/.style={
column name={$2\cdot \text{level}+4$},
preproc/expr={2*##1 + 4}
}
]
{pgfplotstable.example1.dat}
Empty cells won’t be processed, assuming that a math expression with an “empty number” will fail.
Note that there is also an create col/expr which is more powerful than preproc/expr.
-
/pgfplots/table/multiply by={
real number}
Appends code to the
current
preproc cell content value
which multiplies every cell by
real number. Arithmetics are carried out in floating point.
-
/pgfplots/table/divide by={
real number}
Appends code to the current
preproc cell content value
which divides every cell by
real number. Arithmetics are carried out in floating point.
-
/pgfplots/table/sqrt(style, no value) 
Appends code to the current preproc cell content value which takes the square root \(\sqrt {\cdot }\) of every non-empty cell. Arithmetics are carried out in floating point.
The following example copies the column error1 and applies sqrt to the copy.
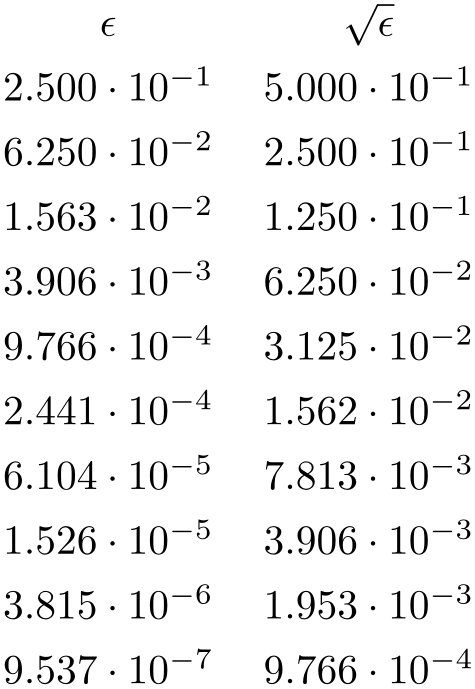
\pgfplotstableset{
columns={error1,sqrterror1},
create on use/sqrterror1/.style={create col/copy=error1},
columns/error1/.style={column name=$\epsilon$},
columns/sqrterror1/.style={sqrt,column name=$\sqrt \epsilon$},
sci,sci 10e,precision=3,sci zerofill
}
\pgfplotstabletypeset{pgfplotstable.example1.dat}
Please take a look at Section 6.3 for details about create on use.
-
/pgfplots/table/multiply -1(style, no value) 
Appends code to current preproc cell content value which multiplies every cell by \(-1\). This style does the same job as multiply by=-1, it is just faster because only the sign changes.
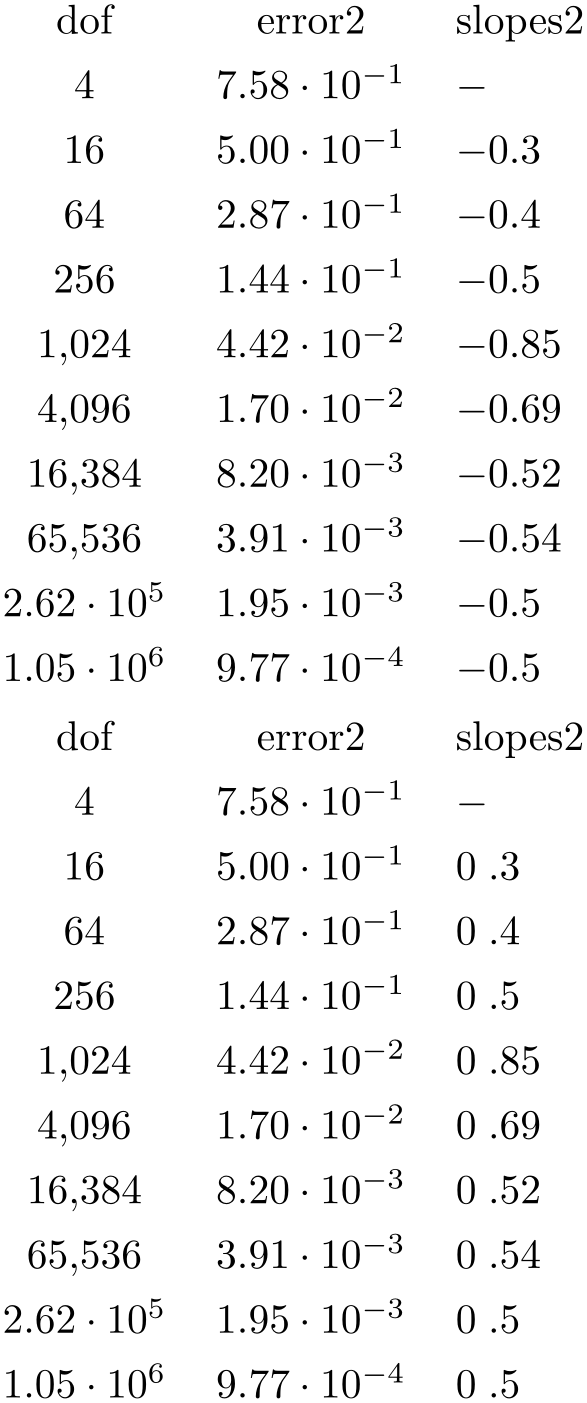
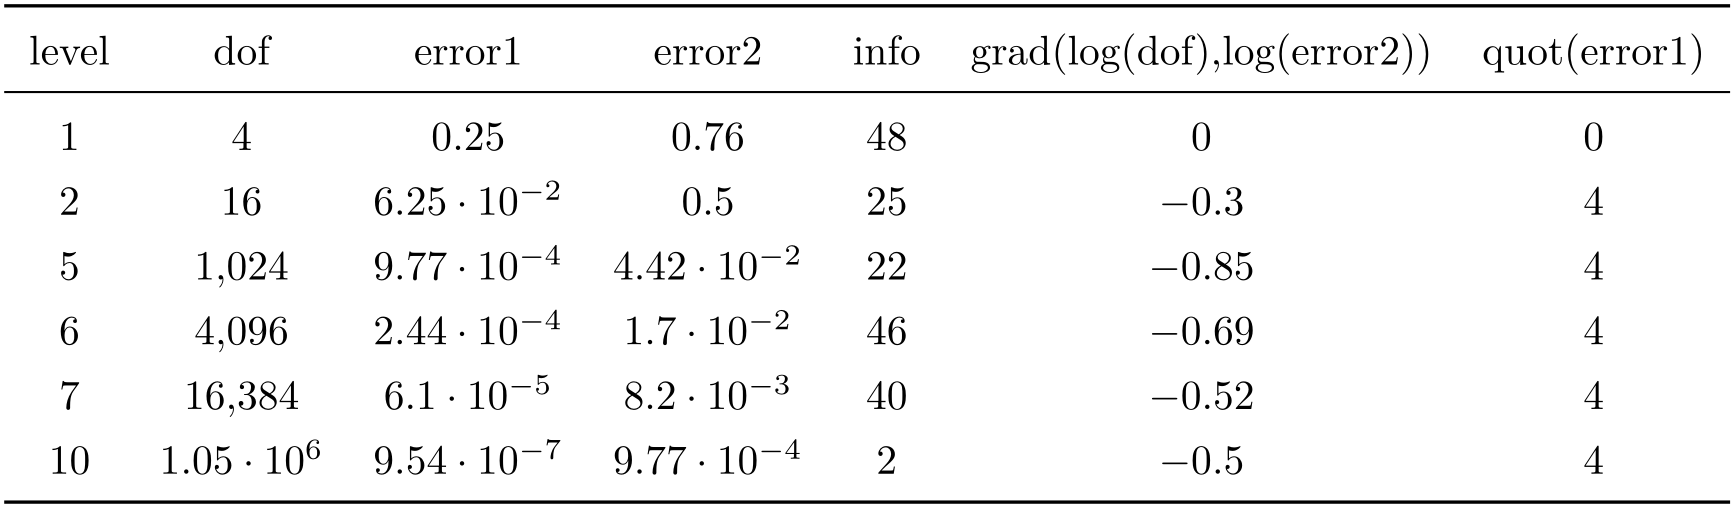
\pgfplotstableset{
columns={dof,error2,slopes2},
                        columns/error2/.style={sci,sci
                    zerofill},
columns/slopes2/.style={dec sep align,empty cells with={\ensuremath{-}}},
create on use/slopes2/.style=
{create col/gradient loglog={dof}{error2}}}
\pgfplotstabletypeset{pgfplotstable.example1.dat}
\pgfplotstabletypeset[columns/slopes2/.append style={multiply -1}]
{pgfplotstable.example1.dat}
A boolean predicate which allows to select particular rows of the input table, based on the current row’s index. The argument #1 contains the current row’s index (starting with \(0\), not counting comment lines or column names).
The return value is assigned to the TeX-if \ifpgfplotstableuserow. If the boolean is not changed, the return value is true.
% requires \usepackage{booktabs}
\pgfplotstabletypeset[
every head row/.style={
before row=\toprule,after row=\midrule},
every last row/.style={
after row=\bottomrule},
row predicate/.code={%
\ifnum#1>4\relax
\ifnum#1<8\relax
\pgfplotstableuserowfalse
\fi
\fi}
]
{pgfplotstable.example1.dat}
Please note that row predicate is applied before any other option which affects row (or column) appearance. It is evaluated before assign cell content. One of the consequences is that even/odd row styles refer to those rows for which the predicate returns true. In fact, you can use row predicate to truncate the complete table before it has actually been processed.
During row predicate, the macro \pgfplotstablerows contains the total number of input rows.
Furthermore, row predicate applies only to the typeset routines, not the read methods. If you want to plot only selected table entries with \addplot table, use the pgfplots coordinate filter options.
-
/pgfplots/table/skip rows between index={
begin}{end}
A style which appends a row predicate which discards selected rows. The selection is done by index where indexing starts with \(0\). Every row with index \(\meta {begin} \le i < \meta {end}\) will be skipped.
% requires \usepackage{booktabs}
\pgfplotstabletypeset[
every head row/.style={
before row=\toprule,after row=\midrule},
every last row/.style={
after row=\bottomrule},
skip rows between index={2}{4},
skip rows between index={7}{9}
]
{pgfplotstable.example1.dat}
-
/pgfplots/table/select equal part entry of={
part no}{part count}
A style
which overwrites
row predicate with a subset
selection predicate. The idea is to split the current column into
part count
equally sized parts and select only
part no.
This can be used to simulate multicolumn tables.
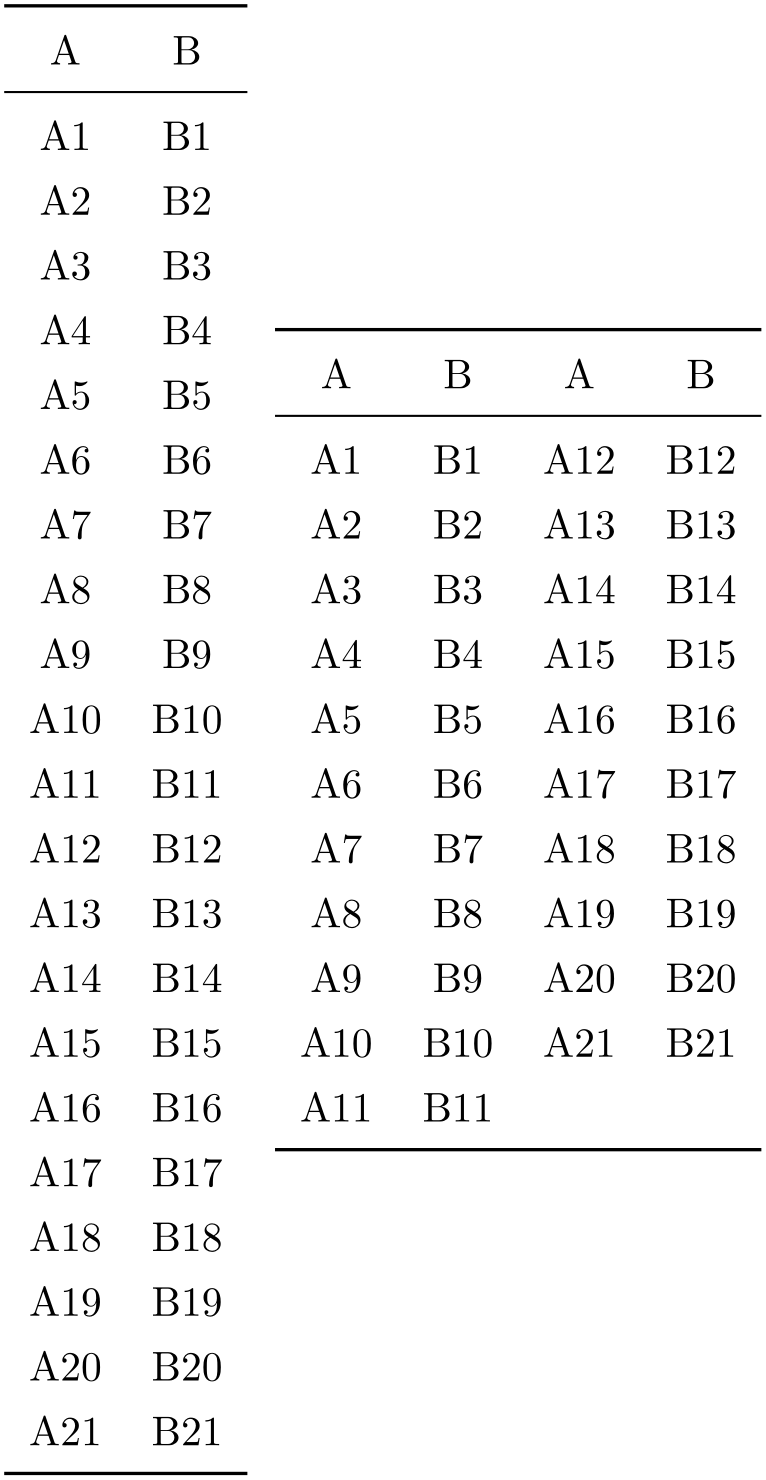
% requires \usepackage{booktabs}
\pgfplotstableset{
every head row/.style={before row=\toprule,after row=\midrule},
every last row/.style={after row=\bottomrule}}
\pgfplotstabletypeset[string type]{pgfplotstable.example2.dat}%
~
\pgfplotstabletypeset[
columns={A,B,A,B},
display columns/0/.style={select equal part entry of={0}{2},string type},% first part of `A'
display columns/1/.style={select equal part entry of={0}{2},string type},% first part of `B'
display columns/2/.style={select equal part entry of={1}{2},string type},% second part of `A'
display columns/3/.style={select equal part entry of={1}{2},string type},% second part of `B'
]
{pgfplotstable.example2.dat}
The example above shows the original file as-is on the left side. The right side shows columns A,B,A,B – but only half of the elements are shown, selected by indices #0 or #1 of #2. The parts are equally large, up to a remainder.
If the available number of rows is not divisible by
part count, the remaining entries are distributed equally among the first parts.
-
/pgfplots/table/unique={
column name}
A style which appends a
row predicate which suppresses
successive occurrences of the same elements in
column name. For example, if
column name
contains 1,1,3,5,5,6,5,0, the application of
unique results in
1,3,5,6,5,0 (the last 5 is kept – it is not directly preceded by another 5).
The algorithm uses string token comparison to find multiple occurrence.105
The argument
column name
can be a column name, index, alias, or
create on use specification (the latter
one must not depend on other
create on use statements). It is not
necessary to provide a
column name
which is part of the output.
However, it is necessary that the unique predicate can be evaluated for all columns, starting with the first one. That means it is an error to provide unique somewhere deep in column-specific styles.
105 To be more precise, the comparison is done using \ifx, i.e. cell contents won’t be expanded. Only the tokens as they are seen in the input table will be used.
6.2.4Postprocessing Cell Content
The postprocessing step is applied after the typesetting stage. Its main purpose is to apply final formatting instructions which are not content-based.
Postprocessing is applied in a column by column fashion, i.e. it can be configured for row styles. See the notes in the introduction of Section 6.2 for details how to apply such styles on specific rows only.
-
• the key @unprocessed cell content which stores the raw input,
-
• the key @cell content after rowcol styles which stores the value of @cell content after evaluating cell specific styles,
-
• the key @preprocessed cell content which stores the result of the preprocessor,
-
• the key @cell content which contains the result of the typesetting routine,
-
• the shorthand ‘#1’ which is also the unprocessed input argument as it has been found in the input table.
Allows to modify assigned cell content after it has been assigned, possibly content-dependent. Ideas could be to draw negative numbers in red, typeset single entries in bold face or insert replacement text.
This key is evaluated after assign cell content. Its semantics is to modify an existing @cell content value.
There may be more than one postproc cell content command, if you use /.append code or /.append style to define them:
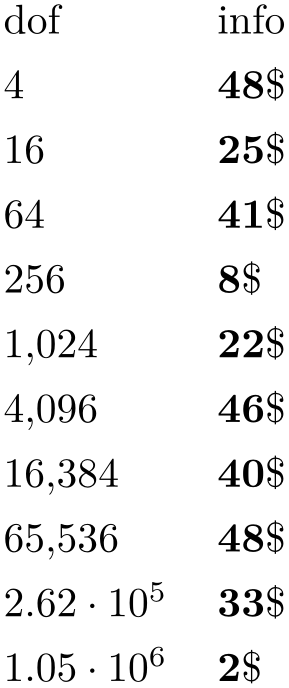
% requires \usepackage{eurosym}
\pgfplotstabletypeset[
column type=r,
columns={dof,info},
columns/info/.style={
% stupid example for multiple postprocessors:
postproc cell content/.append style={
/pgfplots/table/@cell content/.add={$\bf}{$},
},
postproc cell content/.append style={
/pgfplots/table/@cell content/.add={}{\$},
}
}]
{pgfplotstable.example1.dat}
The code above modifies @cell content in two steps. The net effect is to prepend “$\bf ” and to append “$ \$”. It should be noted that pgfkeys handles /.style and /.code in (basically) the same way – both are simple code keys and can be used as such. You can combine both with /.append style and /.append code. Please refer to the PGF/TikZ manual, Section “pgfkeys” for details.
As in assign cell content, the code can evaluate helper macros like \pgfplotstablerow to change only particular entries. Furthermore, the postprocessor may depend on the unprocessed cell input (as it has been found in the input file or produced by the loading procedure) and/or the preprocessed cell value. These values are available as
Remember that you can access the key values using
\pgfkeysvalueof{/pgfplots/table/@preprocessed cell content}
at any time.
This allows complete context-based formatting options. Please remember that empty strings may appear due to column balancing – introduce special treatment if necessary.
There is one special case which occurs if @cell content itself contains the cell separation character ‘&’. In this case, postproc cell content is invoked separately for each part before and after the ampersand and the ampersand is inserted afterwards. This allows compatibility with special styles which create artificial columns in the output (which is allowed, see dec sep align). To allow separate treatment of each part, you can use the macro \pgfplotstablepartno. It is defined only during the evaluation of postproc cell content and it evaluates to the current part index (starting with \(0\)). If there is no ampersand in your text, the value will always be \(0\).
This key is evaluated inside of a local TeX group, so any local macro assignments will be cleared afterwards.
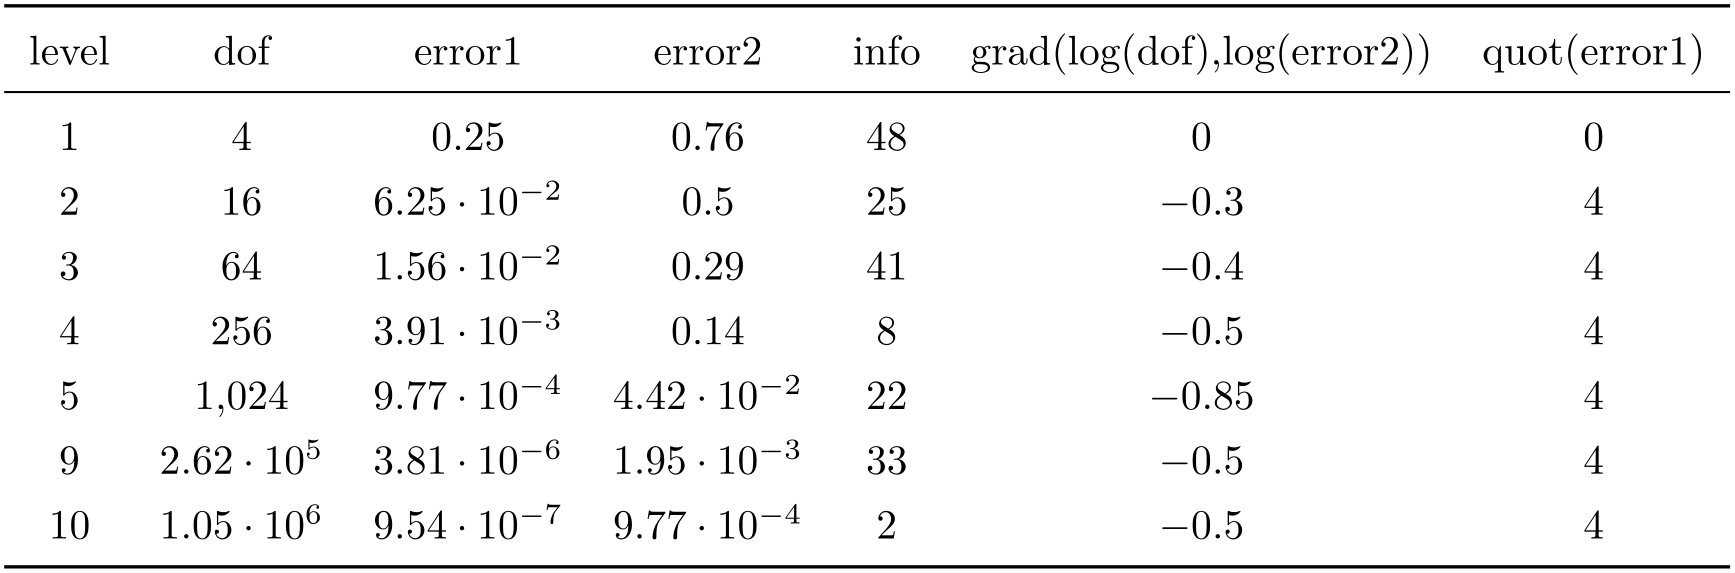
The following example can be used to insert a dash, \(-\), in a slope column:
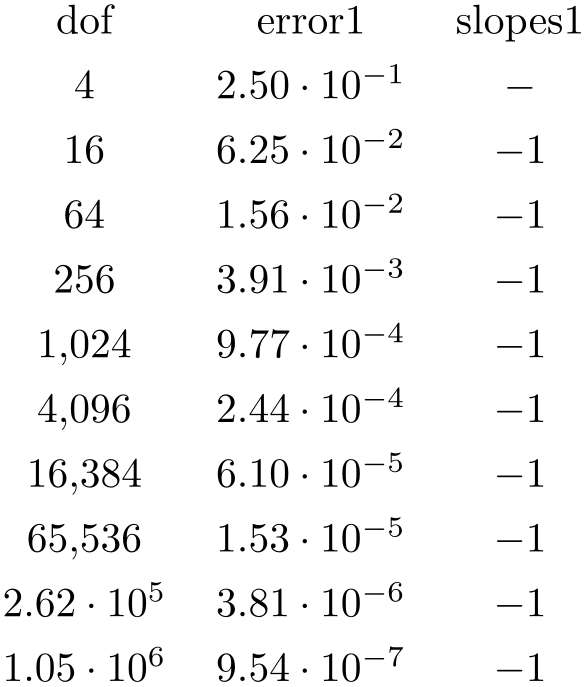
\pgfplotstableset{
create on use/slopes1/.style=
{create col/gradient loglog={dof}{error1}}}
\pgfplotstabletypeset[
columns={dof,error1,slopes1},
                        columns/error1/.style={sci,sci
                    zerofill},
columns/slopes1/.style={
postproc cell content/.append code={%
\ifnum\pgfplotstablerow=0
                                    \pgfkeyssetvalue{/pgfplots/table/@cell
                    content}{\ensuremath{-}}%
\fi
}%
}]
{pgfplotstable.example1.dat}
Since this may be useful in a more general context, it is available as empty cells with style.
Note that header rows are now modified by this key (see assign column name if you want to modify header cell contents).
-
/pgfplots/table/empty cells with={
replacement}
Appends code to
postproc cell content
which replaces any empty cell with
replacement.
If dec sep align is active, the replacement will be inserted only for the part before the decimal separator.
-
/pgfplots/table/set content={
content}
A style which redefines
postproc cell content to
always return the value
content.
-
/pgfplots/table/fonts by sign={
TeX
code for positive}{TeX
code for negative}
Appends code to postproc cell content which allows to set fonts for positive and negative numbers.
The arguments
TeX
code for positive
and
TeX
code for negative
are inserted right before the typeset cell content. It is permissible to use both ways to change
LaTeX
fonts: the \textbf{argument} or the {\bfseries {argument}} way.
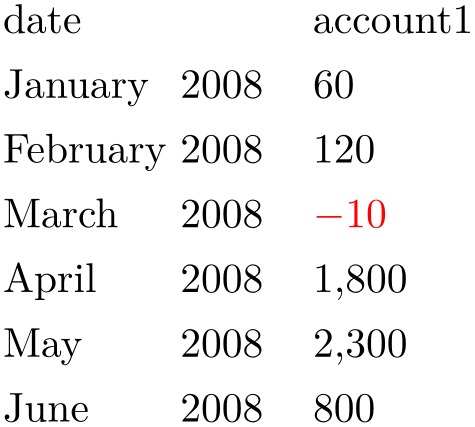
% Requires
% \usepackage{pgfcalendar}
% plotdata/accounts.dat contains:
%
% date account1 account2 account3
% 2008-01-03 60 1200 400
% 2008-02-06 120 1600 410
% 2008-03-15 -10 1600 410
% 2008-04-01 1800 500 410
% 2008-05-20 2300 500 410
% 2008-06-15 800 1920 410
\pgfplotstabletypeset[
columns={date,account1},
column type=r,
columns/date/.style={date type={\monthname\ \year}},
columns/account1/.style={fonts by sign={}{\color{red}}}
]
{plotdata/accounts.dat}
In fact, the arguments for this style don’t need to be font changes. The style fonts by sign inserts several braces and the matching argument into @cell content. To be more precise, it results in
{TeX
code for negative{cell value}} for negative numbers and
{TeX
code for positive{cell value}} for all other numbers.