Manual for Package pgfplots
2D/3D Plots in LATeX, Version 1.18.2
https://github.com/pgf-tikz/pgfplots
PGFplotsTable
6.4Miscellaneous
6.4.1Writing (Modified) Tables To Disk
-
/pgfplots/table/outfile={
 file name
 } (initially empty)
Writes the completely processed table as
TeX
file to
file name. This key is described in all detail on page (page for section 6.1.5).
-
\pgfplotstablesave[
options]{\macro or input file name}{output file name}
This command takes a table and writes it to a new data file (without performing any typesetting).
If the first argument is a file name, that file is loaded first.
This command simply invokes \pgfplotstabletypeset with cleared output parameters. That means any of the column creation methods apply here as well, including any postprocessing steps (without the final typesetting).
\pgfplotstablesave uses the keys reset styles and disable rowcol styles to clear any typesetting related options.
Furthermore, it sets string type to allow verbatim output. You may want to use numeric as string type instead in case you only have numerical data – this will display integers resulting from arithmetics not in scientific notation.109
\pgfplotstablesave[
create on use/postproc1/.style={create col/dyadic refinement rate=error1},
columns={dof,error1,postproc1}
]
{pgfplotstable.example1.dat}
{pgfplotstable.example1.out.dat}
Now, pgfplotstable.example1.out.dat is
dof error1 postproc1
4 2.50000000e-01 {}
16 6.25000000e-02 1.99998
64 1.56250000e-02 1.99998
256 3.90625000e-03 1.99998
1024 9.76562500e-04 1.99998
4096 2.44140625e-04 1.99998
16384 6.10351562e-05 1.99998
65536 1.52587891e-05 1.99998
262144 3.81469727e-06 1.99998
1048576 9.53674316e-07 1.99998
You can use the col sep key inside of
options
to define a column separator for the output file. In case you need a different input column separator, use
in col sep instead of col sep.
-
• Empty cells will be filled with {} if col sep=space. Use the empty cells with style to change that.
-
• Use disable rowcol styles=false inside of
options
if you need to change column/row based styles.
109 Note however, that string type does not round or truncate integers either, even though they are displayed as floats.
6.4.2Miscellaneous Keys
-
/pgfplots/table/disable rowcol styles=true|false (initially false) 
-
• columns/
column name,
-
• display columns/
column index,
-
• every col no
column index,
-
• every row no
row index.
Set this to true if \pgfplotstabletypeset shall not set any styles which apply only to specific columns or only to specific rows.
This disables the styles
-
/pgfplots/table/reset styles(no value) 
-
• every table,
-
• every even row, every odd row, every column, every even column, every odd column,
-
• every first column, every last column, every first row, every last row,
Resets all table typesetting styles which do not explicitly depend on column or row names and indices. The affected styles are
In case you want to reset all, you should also consider the key disable rowcol styles.
6.4.3A summary of how to define and use styles and keys
This section summarizes features of pgfkeys. The complete documentation can be found in the PGF/TikZ manual.
-
Key handler
key/.style={key-value-list}
Defines or redefines a style
key. A style is a normal key which will set all options in
key-value-list
when it is set.
Use \pgfplotstableset{key/.style={key-value-list}} to (re)define a style
key
in the namespace /pgfplots/table.
-
Key handler
key/.append style={key-value-list}
Appends
key-value-list
to an already existing style
key. This is the preferred method to change the predefined styles: if you only append, you maintain compatibility with future
versions.
Use \pgfplotstableset{key/.append style={key-value-list}} to append
key-value-list
to the style
key. This will assume the prefix /pgfplots/table.
-
Key handler
key/.initial={value}
-
Key handler
key/.add={before}{after}
Changes
key
by prepending
before
and appending
after.

\pgfplotstableset{columns={a column}}
`\pgfkeysvalueof{/pgfplots/table/columns}';
\pgfplotstableset{columns/.add={}{,another}}
`\pgfkeysvalueof{/pgfplots/table/columns}';
\pgfplotstableset{columns/.add={}{,and one more}}
`\pgfkeysvalueof{/pgfplots/table/columns}'.
This can be used inside of \pgfplotsinvokeforeach or similar (ungrouped!) loop constructs.
-
Key handler
key/.code={TeX
code}
Occasionally, the pgfplots user interface offers to replace parts of its routines. This is
accomplished using so called “code keys”. What it means is to replace the original key and its behavior with new
TeX
code. Inside of
TeX
code, any command can be used. Furthermore, the #1 pattern will be the argument provided to the key.

\pgfplotsset{
                        My Code/.code={This is a
                    pgfkeys feature. Argument=`#1'}}
\pgfplotsset{My Code={is here}}
The example defines a (new) key named My Code. Essentially, it is nothing else but a \newcommand, plugged into the key–value interface. The second statement “invokes” the code key.
-
Key handler
key/.code 2 args={TeX
code}
As /.code, but this handler defines a key which accepts two arguments. When the so defined key is used, the two arguments are available as #1 and #2.
6.4.4Plain TeX and ConTeXt support
The table code generator is initialized to produce LaTeX tabular environments. However, it only relies on ‘&’ being the column separator and ‘\\’ the row terminator. The column type feature is more or less specific to tabular, but you can disable it completely. Replace begin table and end table with appropriate TeX or ConTeXt commands to change it. If you have useful default styles (or bug reports), let me know.
6.4.5Basic Level Table Access and Modification
PgfplotsTable provides several methods to access and manipulate tables at an elementary level.
Please keep in mind that PgfplotsTable has been written as a tool for table visualization. As such, it has been optimized for the case of relatively few rows (although it may have a lot of columns). The runtime for table creation and modification is currently \(O(N^2)\) where \(N\) is the number of rows.110 This is completely acceptable for tables with few rows because TeX can process those structures relatively fast. Keep your tables small! PgfplotsTable is not a tool for large-scale matrix operations.
Tables are always stored as a sequence of column vectors. Therefore, iteration over all values in one column is simple whereas iteration over all values in one row is complicated and expensive.
-
\pgfplotstableforeachcolumn
table\as{\macro}{code}
Iterates over every column name of
table. The
\macro
will be set to the currently visited column name. Then,
code
will be executed. During
code, \pgfplotstablecol denotes the current
column index (starting with 0).
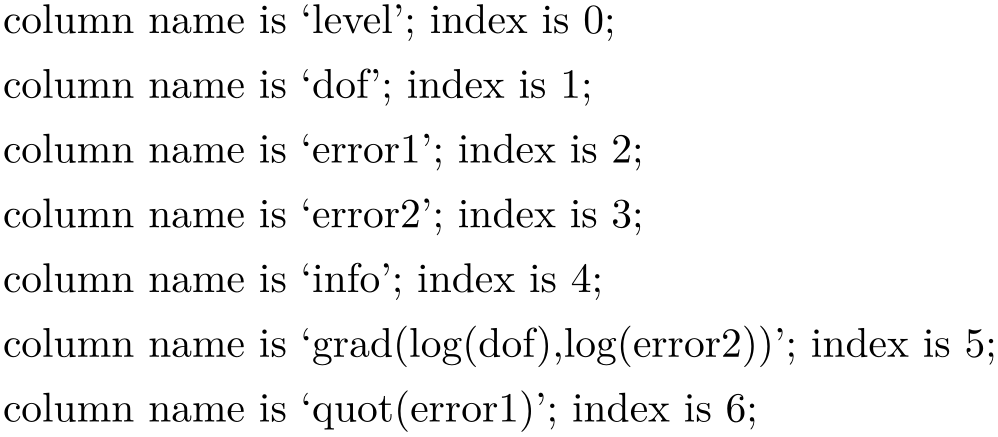
\begin{minipage}{0.8\linewidth}
\pgfplotstableread{pgfplotstable.example1.dat}\loadedtable
\pgfplotstableforeachcolumn\loadedtable\as\col{%
                        column name is `\col'; index is
                    \pgfplotstablecol;\par
}
\end{minipage}
This routine does not introduce
TeX
groups, variables inside of
code
are not scoped.
-
\pgfplotstableforeachcolumnelement
column name\oftable\as\cellcontent{code}
Reports every table cell \(t_{ij}\) for a fixed column \(j\) in read-only mode.
For every cell in the column named
column name,
code
will be executed. During this invocation, the macro
\cellcontent
will contain the cell’s content and
\pgfplotstablerow will contain the current
row’s index.
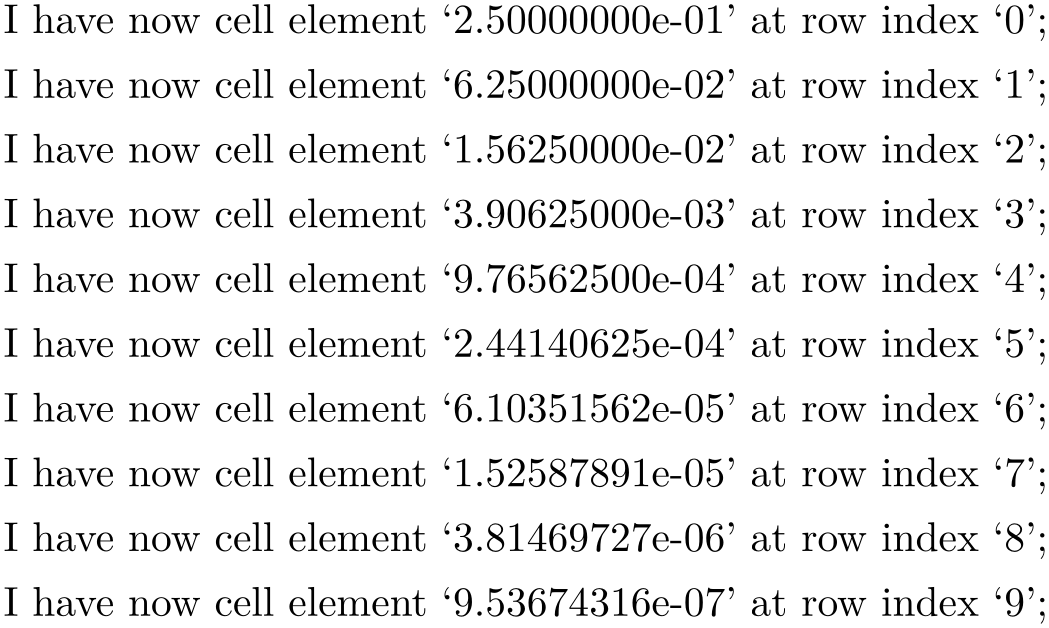
\begin{minipage}{0.8\linewidth}
\pgfplotstableread{pgfplotstable.example1.dat}\loadedtable
\pgfplotstableforeachcolumnelement{error1}\of\loadedtable\as\cell{%
I have now cell element `\cell' at row index `\pgfplotstablerow';\par
}
\end{minipage}
The argument
column name
can also be a column index. In that case, it should contain [index]integer, for example [index]4. Furthermore, column aliases and columns which should be generated on the fly (see
create on use) can be used for
column name.
This routine does not introduce
TeX
groups, variables inside of
code
are not scoped.
-
\pgfplotstablemodifyeachcolumnelement
column name\oftable\as\cellcontent{code}
A routine which is similar to
\pgfplotstableforeachcolumnelement, but any changes of
\cellcontent
which might occur during
code
will be written back into the respective cell.
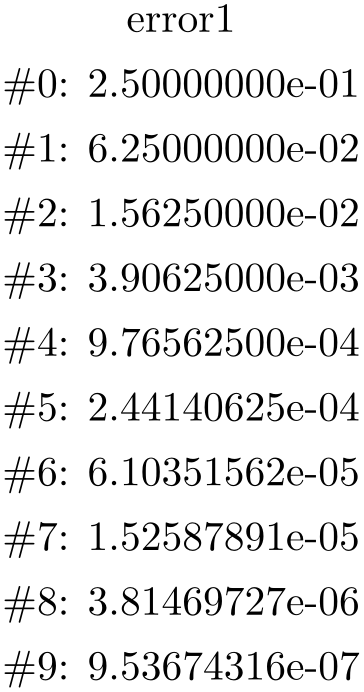
\pgfplotstableread{pgfplotstable.example1.dat}\loadedtable
\pgfplotstablemodifyeachcolumnelement{error1}\of\loadedtable\as\cell{%
\edef\cell{\#\pgfplotstablerow: \cell}%
}
\pgfplotstabletypeset[columns=error1,string type]{\loadedtable}
If
column name
is a column alias or has been created on the fly, a new column named
column name
will be created.
-
\pgfplotstablegetelem{
row}{col}\oftable
Selects a single table element at row
row
and column
col. The second argument has the same format as that described in the last paragraph: it should be a column name or a column
index (in which case it needs to be written as [index]number).
The return value will be written to \pgfplotsretval.
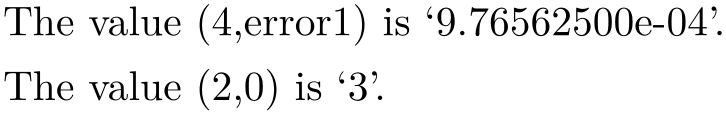
\pgfplotstableread{pgfplotstable.example1.dat}{\loadedtable}
\pgfplotstablegetelem{4}{error1}\of{\loadedtable}
The value (4,error1) is `\pgfplotsretval'.
\pgfplotstablegetelem{2}{[index]0}\of{\loadedtable}
The value (2,0) is `\pgfplotsretval'.
If possible, avoid using this command inside of loops. It is quite slow.
-
\pgfplotstablegetcolumnnamebyindex{
col index}\oftable\tomacro
Retrieves the column name at
col index
from a
table
and stores it into a
macro.

\pgfplotstableread{pgfplotstable.example1.dat}{\loadedtable}
\pgfplotstablegetcolumnnamebyindex{4}\of{\loadedtable}\to\pgfplotsretval
The name of column 4 `\pgfplotsretval'.
Note that
table
must be a loaded table, i.e. it must be a macro resulting from
\pgfplotstableread. Column indices start at \(0\).
-
\pgfplotstablegetrowsof{
file name or \loadedtable}
-
\pgfplotstablegetcolsof{
file name or \loadedtable}
Defines \pgfplotsretval to be the number of rows or columns
respectively in a table.111 The argument may be either a file name or an
already loaded table (the
\macro
of \pgfplotstableread).
-
\pgfplotstablevertcat{
\table1}{\table2 or filename}
See page (page for section 6.3.1) for details about this command.
-
\pgfplotstablenew[
options]{row count}{\table}
See Section 6.3 for details about this command.
-
\pgfplotstablecreatecol[
options]{row count}{\table}
See Section 6.3 for details about this command.
-
\pgfplotstabletranspose[
options]{\outtable}{\table or filename}
-
\pgfplotstabletranspose*[
options]{\outtable}{\table or filename}
-
/pgfplots/table/colnames from={
colname} (initially empty)
-
/pgfplots/table/input colnames to={
name} (initially colnames)
-
/pgfplots/table/columns={
list} (initially empty)
Defines
\outtable
to be the transposed of
\table or filename. The input argument can be either a file name or an already loaded table.
The version with ‘*’ is only interesting in conjunction with the columns option, see below.
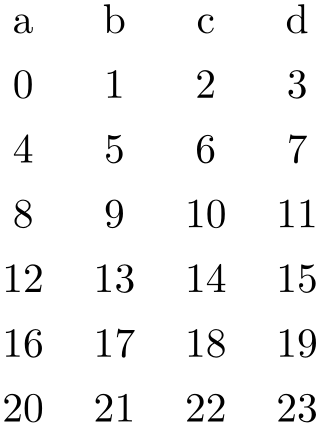
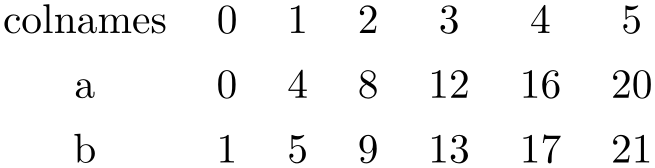
\pgfplotstabletypeset[string type]{pgfplotstable.example3.dat}
\pgfplotstabletranspose\loadedtable{pgfplotstable.example3.dat}
\pgfplotstabletypeset[string type]\loadedtable
The optional argument
options
can contain options which influence the transposition:
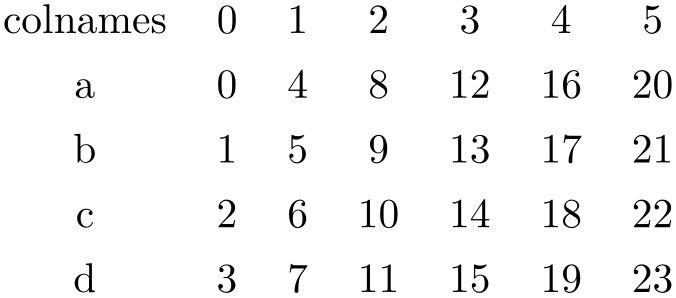
Inside of \pgfplotstabletranspose, this key handles how to define output column names.
If
colname
is empty (the initial value), the output column names will simply be the old row indices, starting
with \(0\).
If
colname
is not empty, it denotes an input column name whose cell values will make up the output column names:
\pgfplotstabletranspose[colnames from=c]\loadedtable{pgfplotstable.example3.dat}
\pgfplotstabletypeset[string type]\loadedtable
The argument
colname
won’t appear as cell contents. It is an error if the cells in
colname
don’t yield unique column names.
Inside of \pgfplotstabletranspose, this key handles what to do with input column names.
This key will create a further column named
name
which will be filled with the input column names (as string type).
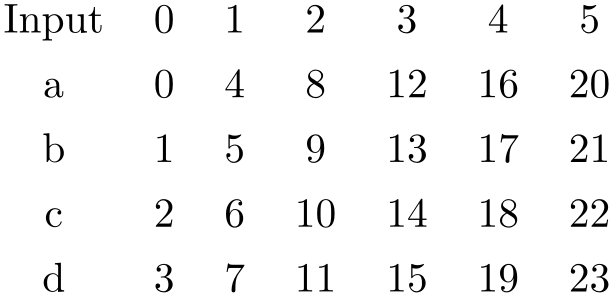
\pgfplotstabletranspose[input colnames to=Input]\loadedtable{pgfplotstable.example3.dat}
\pgfplotstabletypeset[string type]\loadedtable
Set
name
to the empty string to disable this column.

\pgfplotstabletranspose[input colnames to=]\loadedtable{pgfplotstable.example3.dat}
\pgfplotstabletypeset[string type]\loadedtable
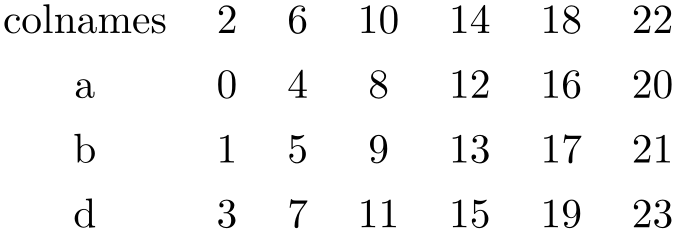
Inside of \pgfplotstabletranspose, this key handles which input columns shall be considered for the transposition.
If
list
is empty, all columns of the input table will be used (which is the initial configuration).
If
list
is not empty, it is expected to be a list of column names. Only these columns will be used as input for the
transposition, just as if the remaining ones weren’t there. It is acceptable to provide column aliases or
create on use arguments inside of
list.
\pgfplotstabletranspose[columns={a,b}]\loadedtable{pgfplotstable.example3.dat}
\pgfplotstabletypeset[string type]\loadedtable
Here is the only difference between \pgfplotstabletranspose and \pgfplotstabletranspose*: the version without ‘*’ resets the columns key before it starts whereas the version with ‘*’ simply uses the actual content of columns.
-
\pgfplotstablesort[
options]\resulttable\table or filename
-
/pgfplots/table/sort key={
column} (initially [index]0)
-
/pgfplots/table/sort cmp={
less than routine} (initially float <)
-
/pgfplots/fixed <(no value) 
-
/pgfplots/fixed >(no value) 
-
/pgfplots/int <(no value) 
-
/pgfplots/int >(no value) 
-
/pgfplots/float <(no value) 
-
/pgfplots/float >(no value) 
-
/pgfplots/date <(no value) 
-
/pgfplots/date >(no value) 
-
/pgfplots/string <(no value) 
-
/pgfplots/string >(no value) 
-
/pgfplots/iflessthan/.code args={##1##2##3##4}{
 ...
... }
}
Sorts
\table or filename
according to
options
and writes the sorted table to
\resulttable.
Use the high level sort key to enable sorting automatically during \pgfplotstabletypeset.
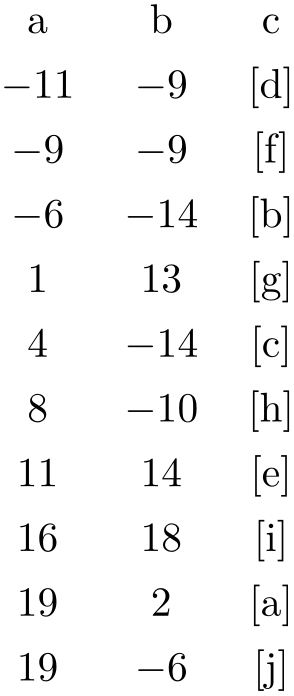
\pgfplotstablesort\result{%
a b c
19 2 [a]
-6 -14 [b]
4 -14 [c]
-11 -9 [d]
11 14 [e]
-9 -9 [f]
1 13 [g]
8 -10 [h]
16 18 [i]
19 -6 [j]
}
\pgfplotstabletypeset[columns/c/.style={string type}]{\result}%
The sort key and comparison function can be customized using the following keys:
Specifies the column
which contains the sort key. The argument
column
can be any of the columns of the input table, including
create on use, alias or [index]integer
specifications. The initial setting uses the first available column.
Allows to use a different comparison function.
These styles constitute the predefined comparison functions. The fixed <, int < and float < routines operate on numerical data where int < expects positive or negative integers and the other two expect real numbers. The fixed < has a considerably smaller number range, but is slightly faster than float <.
The date < compares dates of the form YYYY-MM-DD. The string < uses lexicographical string comparison based on the ASCII character codes of the sort keys. The string < routine also evaluates ASCII codes of control sequences or active characters.112
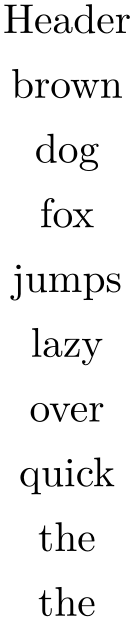
\pgfplotstablesort[sort cmp=string <]\result{% 'Header' is the column name:
Header
the
quick
brown
fox
jumps
over
the
lazy
dog
}
\pgfplotstabletypeset[string type]{\result}%
The argument
less than routine
is actually a style: it is supposed to be one or more keys with /pgfplots/ key prefix. Consequently, all
these predefined sort comparisons are actually keys which define
iflessthan. For example, we have the definition of
string < as follows:
\makeatletter
\pgfplotsset{
string </.style={%
iflessthan/.code args={##1##2##3##4}{%
\t@pgfplots@toka=\expandafter{##1}%
\t@pgfplots@tokb=\expandafter{##2}%
\edef\pgfplots@loc@TMPa{{\the\t@pgfplots@toka}{\the\t@pgfplots@tokb}}%
\expandafter\pgfplotsutilstrcmp\pgfplots@loc@TMPa
\if1\pgfplotsretval ##3\else ##4\fi
}%
},%
}
Allows to define custom comparison functions (a strict ordering). It compares #1 < #2 and invokes #3 in case the comparison is true and #4 if not. The comparison will be evaluated in local scopes (local variables are freed afterwards).
In order to be used as value for
sort cmp, the iflessthan routine needs to be
defined inside of the value
sort cmp=less than routine:
110 The runtime for plot table is linear in the number of rows using a special routine.
111 It will also assign \pgfmathresult to the same value.
112 As long as they haven’t been consumed by TeX’s preprocessing.
6.4.6Repeating Things: Loops
-
\foreach
variables
in
list
{commands}
A powerful loop command provided by TikZ, see the PGF/TikZ manual, Section “Utilities”.

                    \foreach \x in {1,2,...,4} {Iterating
                    \x. }%
A pgfplots related example could be
The following loop commands come with pgfplots. They are similar to the powerful TikZ \foreach loop command, which, however, is not always useful for table processing: the effect of its loop body end after each iteration.
The following pgfplots looping macros are an alternative.
-
\pgfplotsforeachungrouped
variable
in
list
{command}
A specialized variant of
\foreach which can do two things: it does not
introduce extra groups while executing
command
and it allows to invoke the math parser for (simple!)
\(x_0\),\(x_1\),...,\(x_n\)
expressions.

\def\allcollected{}
\pgfplotsforeachungrouped \x in {1,2,...,4} {Iterating \x. \edef\allcollected{\allcollected, \x}}%
All collected = \allcollected.
A more useful example might be to work with tables:
\pgfplotsforeachungrouped \i in {1,2,...,10} {%
\pgfplotstablevertcat{\output}{datafile\i} % appends `datafile\i' -> `\output'
}%
% since it was ungrouped, \output is still defined (would not work
% with \foreach)
The special syntax
list=\(x_0\),\(x_1\),...,\(x_n\), i.e. with two leading elements, followed by dots and a final element, invokes the math parser for the loop. Thus, it allows
larger number ranges than any other syntax if /pgf/fpu is
active. In all other cases,
\pgfplotsforeachungrouped invokes
\foreach and provides the results without
TeX
groups.
-
\pgfplotsinvokeforeach{
list} {command}
A variant of
\pgfplotsforeachungrouped (and
such also of \foreach) which replaces any occurrence of #1 inside of
command
once for every element in
list. Thus, it actually assumes that
command
is like a \newcommand body.
In other words,
command
is invoked for every element of
list. The actual element of
list
is available as #1.
As \pgfplotsforeachungrouped, this command does not introduce extra scopes (i.e. it is ungrouped as well).
The difference to \foreach \x in list{command} is subtle: the \x would not be expanded whereas #1 is.
The counterexample would use a macro (here \x) as loop argument:
You cannot nest this command yet (since it does not introduce protection by scopes).