Manual for Package pgfplots
2D/3D Plots in LATeX, Version 1.18.2
https://github.com/pgf-tikz/pgfplots
Memory and Speed considerations
7.1Memory Limits of TeX
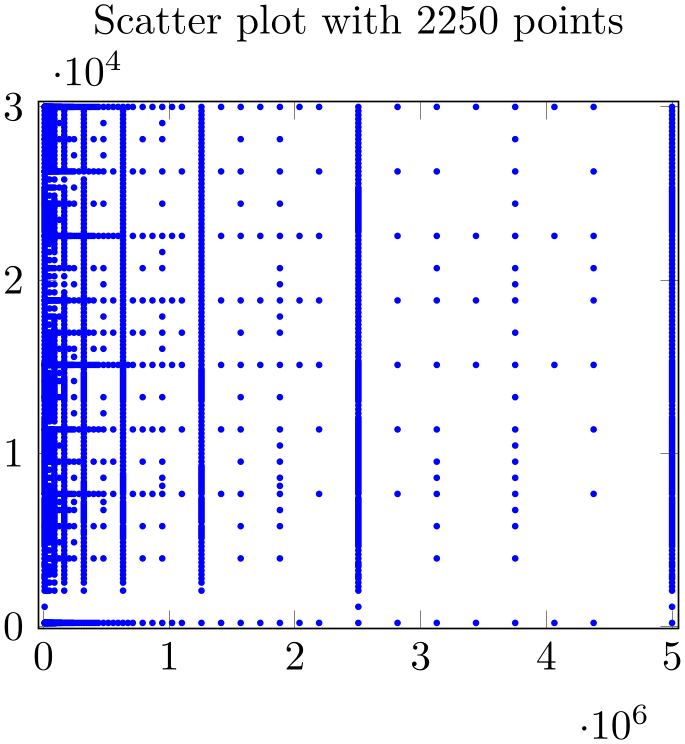
pgfplots can typeset plots with several thousand points if memory limits of TeX are configured properly. Its runtime is roughly proportional to the number of input points.113
% Preamble: \pgfplotsset{width=7cm,compat=1.18}
\begin{tikzpicture}
\begin{axis}[
enlargelimits=0.01,
title style={yshift=5pt},
                    title=Scatter plot with $2250$
                points,
]
\addplot [
blue,
mark=*,
only marks,
mark options={scale=0.3},
] file [skip first]
{plotdata/pgfplots_scatterdata3.dat};
\end{axis}
\end{tikzpicture}
% Preamble: \pgfplotsset{width=7cm,compat=1.18}
\begin{tikzpicture}
\begin{axis}[
enlarge x limits=0.03,
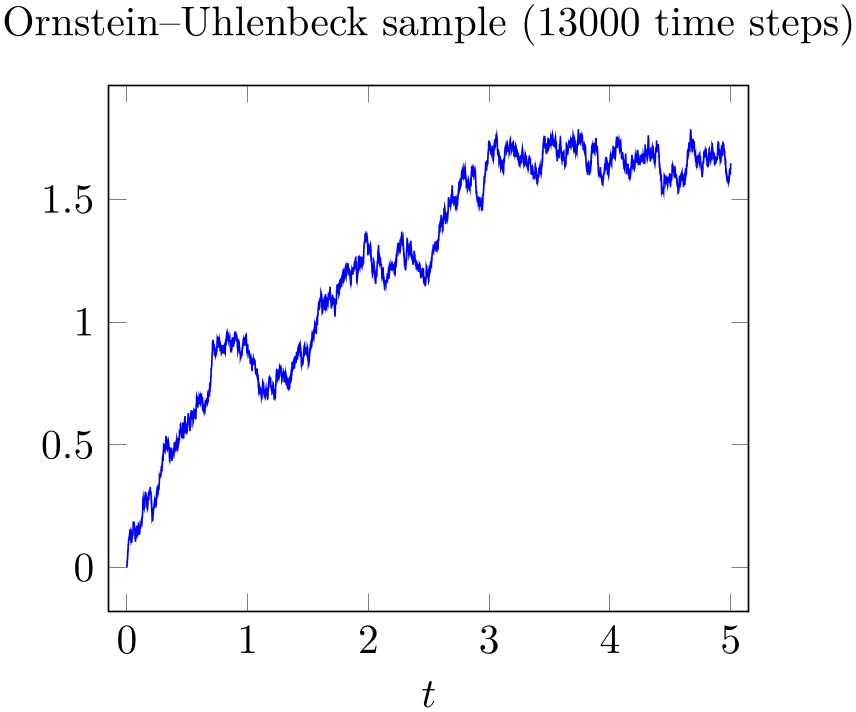
title=Ornstein--Uhlenbeck sample
($13000$ time steps),
xlabel=$t$,
]
\addplot [blue] file {plotdata/ou.dat};
\end{axis}
\end{tikzpicture}
% Preamble: \pgfplotsset{width=7cm,compat=1.18}
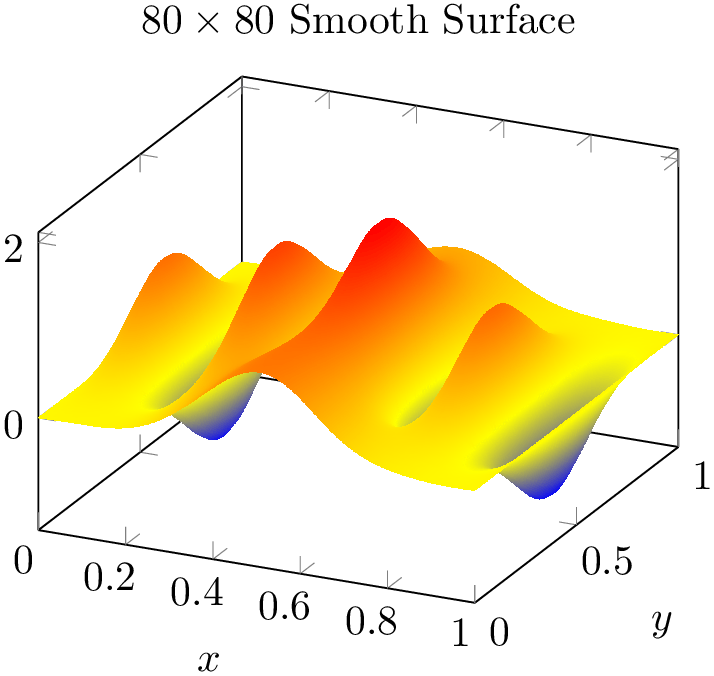
% huger graphs are possible; consider lualatex
\begin{tikzpicture}
\begin{axis}[
                    title=$80 \times 80$ Smooth
                Surface,
xlabel=$x$,
ylabel=$y$,
]
\addplot3 [surf,samples=80,shader=interp,domain=0:1]
{sin(deg(8*pi*x))* exp(-20*(y-0.5)^2)
+ exp(-(x-0.5)^2*30
- (y-0.25)^2 - (x-0.5)*(y-0.25))};
\end{axis}
\end{tikzpicture}
pgfplots relies completely on TeX to do all typesetting. It uses the front-end-layer and basic layer of pgf to perform all drawing operations. For complicated plots, this may take some time, and you may want to read Chapter 8 for how to write single figures to external graphics files. Externalization is the best way to reduce typesetting time.
However, for large scale plots with a lot of points, limitations of TeX’s capacities are reached easily.