Manual for Package pgfplots
2D/3D Plots in LATeX, Version 1.18.2
https://github.com/pgf-tikz/pgfplots
The Reference
4.16Grid Options
-
/pgfplots/xminorgrids=true|false (initially false) 
-
/pgfplots/yminorgrids=true|false (initially false) 
-
/pgfplots/zminorgrids=true|false (initially false) 
-
/pgfplots/xmajorgrids=true|false (initially false) 
-
/pgfplots/ymajorgrids=true|false (initially false) 
-
/pgfplots/zmajorgrids=true|false (initially false) 
-
/pgfplots/grid=minor|major|both|none (initially false) 
Enables/disables different grid lines. Major grid lines are placed at the normal tick positions (see xmajorticks) while minor grid lines are placed at minor ticks (see xminorticks).
This example employs the coordinates defined on page (page for ?? 380).
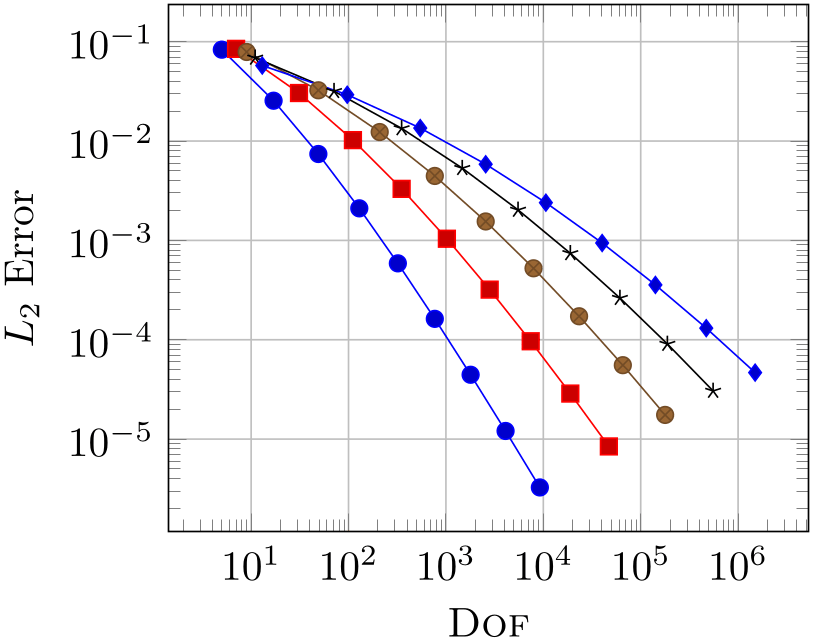
% Preamble: \pgfplotsset{width=7cm,compat=1.18}
\begin{tikzpicture}
\begin{loglogaxis}[
xlabel={\textsc{Dof}},
ylabel={$L_2$ Error},
grid=major,
]
% see above for this macro:
\plotcoords
\end{loglogaxis}
\end{tikzpicture}
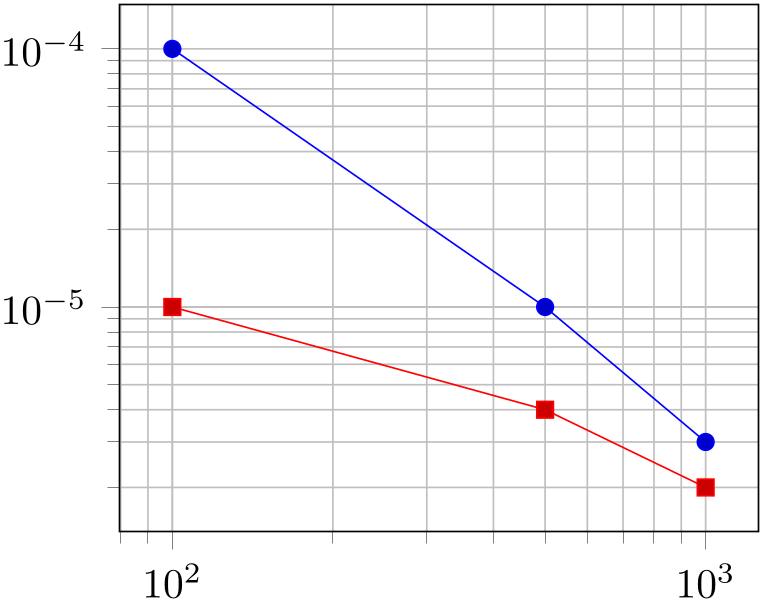
% Preamble: \pgfplotsset{width=7cm,compat=1.18}
\begin{tikzpicture}
\begin{loglogaxis}[
grid=both,
tick align=outside,
tickpos=left,
]
                        \addplot coordinates
                    {
(100,1e-4) (500,1e-5) (1000,3e-6)
};
                        \addplot coordinates
                    {
(100,1e-5) (500,4e-6) (1000,2e-6)
};
\end{loglogaxis}
\end{tikzpicture}
Grid lines will be drawn before tick lines are processed, so ticks will be drawn on top of grid lines. You can configure the appearance of grid lines with the styles
\pgfplotsset{grid style={help lines}} % modifies the style `every axis grid'
                    \pgfplotsset{minor grid style={color=blue}} % modifies
                    the style `every minor grid'
\pgfplotsset{major grid style={thick}} % modifies the style `every major grid'