Manual for Package pgfplots
2D/3D Plots in LATeX, Version 1.18.2
https://github.com/pgf-tikz/pgfplots
The Reference
4.20The Picture’s Size: Bounding Box and Clipping
This section explains how a picture receives its final dimensions. The picture’s dimension is the bounding box. It is possible to restrict the bounding box, but display graphical elements outside of the bounding box. This is called subject of Section 4.20.1. Another use case is to restrict both the bounding box and the clip the graphical elements to some outer path which is subject of Section 4.20.2.
4.20.1Bounding Box Restrictions
Bounding box restrictions are a useful and often necessary tool if multiple pictures need to be aligned properly. Consequently, it is often applied together with the Alignments methods of Section 4.19.
Bounding box restrictions can be achieved with several methods of pgf:
-
1. The overlay option,
-
2. The pgfinterruptboundingbox environment,
-
3. The \pgfresetboundingbox command,
-
4. The \useasboundingbox path,
-
5. The trim left and trim right feature (which is the only supported way of restricted bounding boxes and image externalization; at least for pdf output).
An additional item is a specific use case of pgfplots:
-
6. The hide axis feature will exclude any axis specific stuff from the bounding box. See the reference for hide axis for details.
Note that image externalization (the external library) is more or less incompatible with methods 1 to 4. The problem is that pdflatex crops everything outside of the bounding box away. There are only two safe ways to “restrict” bounding boxes of external .pdf images: the first is the mentioned trim left/trim right feature and the second is to use negative \hspace or \vspace commands (or options to \includegraphics).
-
/tikz/overlay(no value) 
A special key of pgf which disables bounding box updates for (parts of) the image. The effect is that those parts are an “overlay” over the document.
For pgfplots, overlay can be useful to position legends or other axis descriptions outside of the axis – without affecting its size (and without affecting alignment).
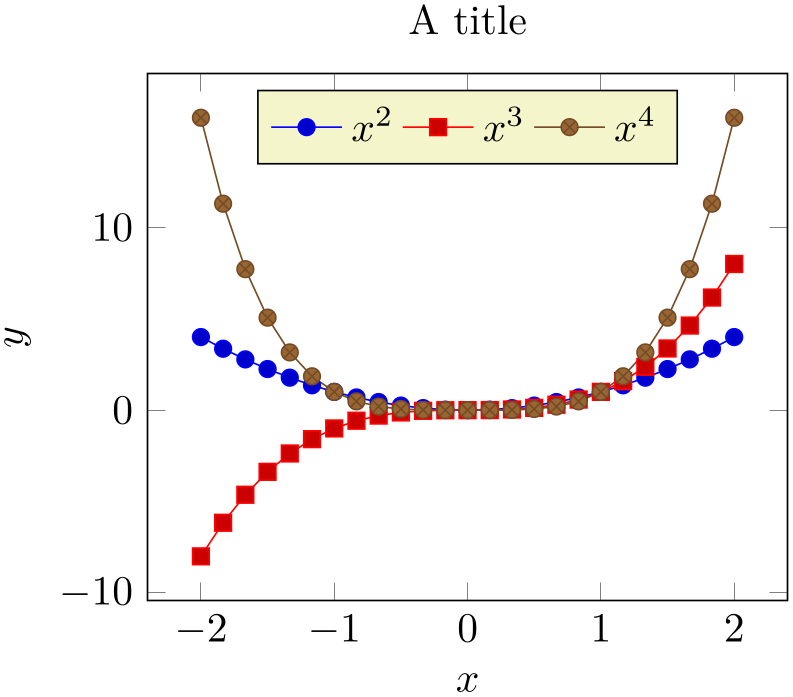
For example, one may want to include only certain parts of the axis into the final bounding box. This would allow horizontal alignment (centering):
% Preamble: \pgfplotsset{width=7cm,compat=1.18}
\begin{tikzpicture}
\begin{axis}[
title=A title,
ylabel style={overlay},
yticklabel style={overlay},
xlabel={$x$},
ylabel={$y$},
legend style={at={(0.5,0.97)},
anchor=north,legend columns=-1},
domain=-2:2,
]
\addplot {x^2};
\addplot {x^3};
\addplot {x^4};
\legend{$x^2$,$x^3$,$x^4$}
\end{axis}
\end{tikzpicture}
Now, the left axis descriptions (\(y\) label and \(y\) ticks) stick out of the bounding box.
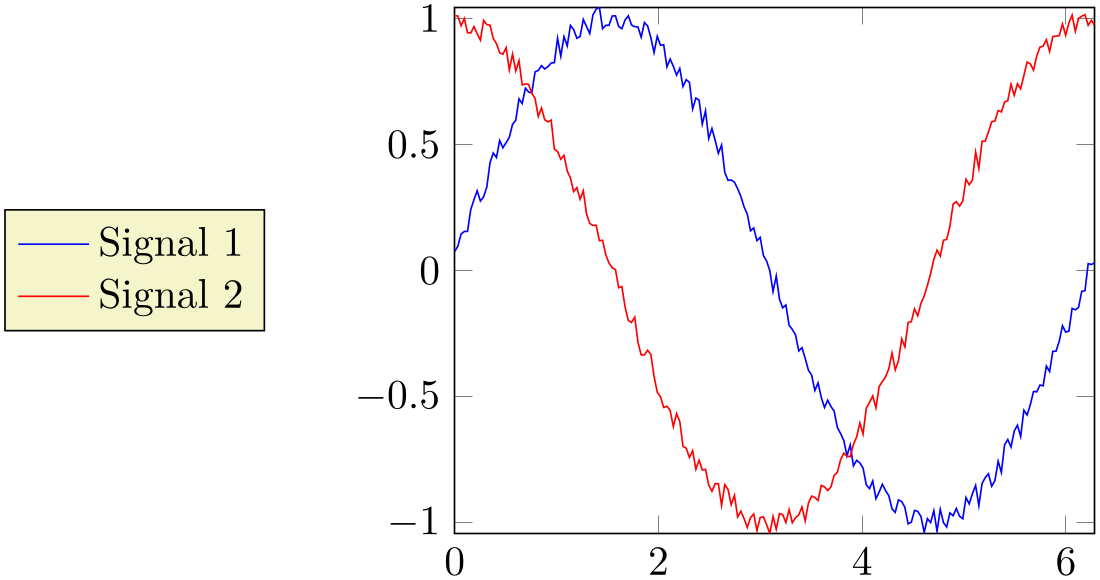
The following example places a legend somewhere without affecting the bounding box.
% Preamble: \pgfplotsset{width=7cm,compat=1.18}
\begin{tikzpicture}
\begin{axis}[
domain=0:6.2832,samples=200,
legend style={
overlay,
at={(-0.5,0.5)},
anchor=center},
every axis plot post/.append style={mark=none},
enlargelimits=false,
]
                        \addplot {sin(deg(x)+3) +
                    rand*0.05};
                        \addplot {cos(deg(x)+2) +
                    rand*0.05};
\legend{Signal 1,Signal 2}
\end{axis}
\end{tikzpicture}
More information about the overlay option can be found in the the PGF/TikZ manual.
-
\pgfresetboundingbox 
This command of pgf resets the bounding box of the current picture. The computation starts from scratch afterwards, allowing to compute a user-defined bounding box.
% Preamble: \pgfplotsset{width=7cm,compat=1.18}
\setlength{\fboxsep}{0pt}%
\fbox{%
\begin{tikzpicture}
\begin{axis}[
title=A title,
xlabel={$x$},
ylabel={$y$},
legend style={at={(0.5,0.97)},
anchor=north,legend columns=-1},
domain=-2:2,
]
\addplot {x^2};
\addplot {x^3};
\addplot {x^4};
\legend{$x^2$,$x^3$,$x^4$}
\end{axis}
\pgfresetboundingbox
\path
                                  (current axis.south
                    west)
rectangle (current axis.north east);
\end{tikzpicture}%
}
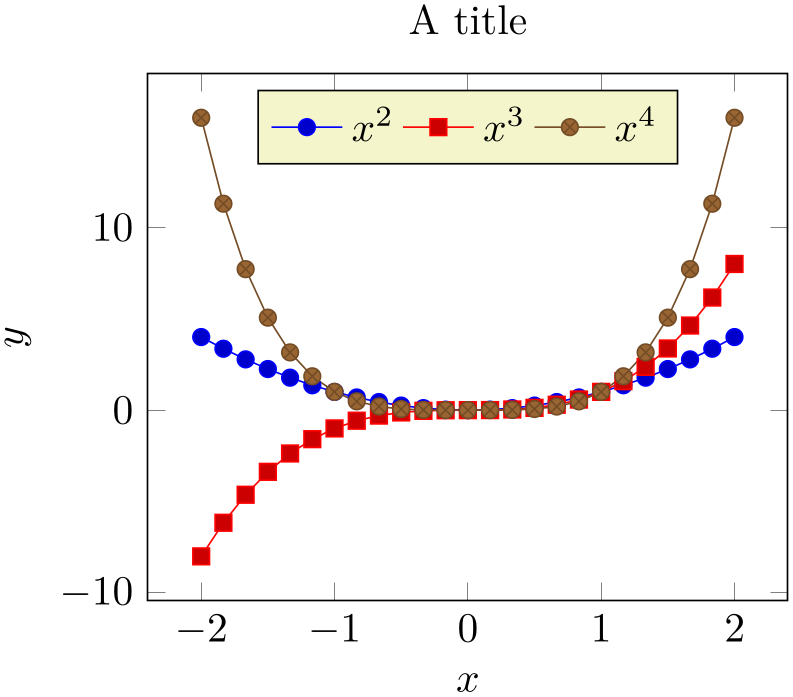
The example draws a normal picture, containing an axis. Afterwards, it throws the bounding box away and creates a new one based on the current axis node and its anchors.
-
\begin{pgfinterruptboundingbox} 
-
 environment contents
-
\end{pgfinterruptboundingbox} 
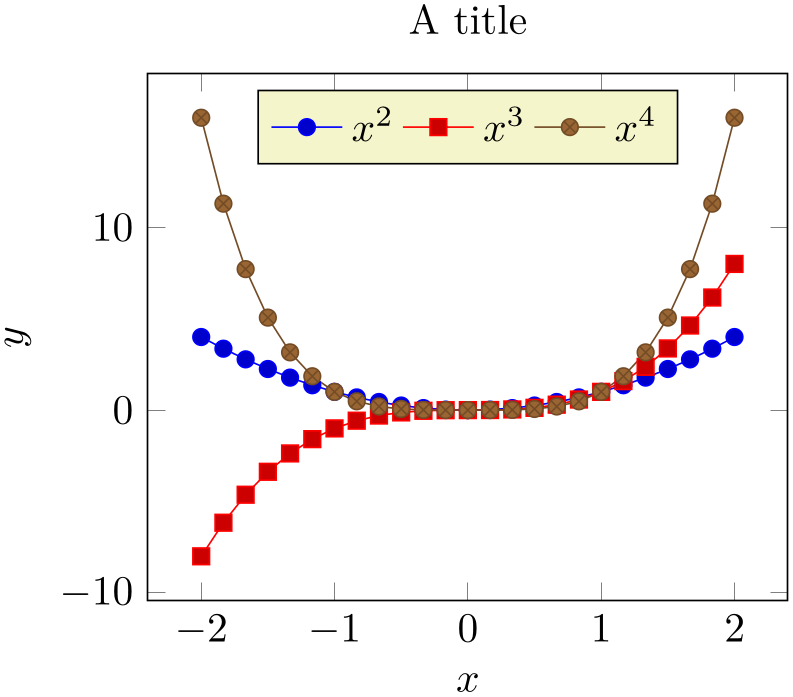
Yet another approach with the same effect is shown below: the bounding box is interrupted manually, and resumed afterwards.
% Preamble: \pgfplotsset{width=7cm,compat=1.18}
\setlength{\fboxsep}{0pt}%
\fbox{%
\begin{tikzpicture}
\begin{pgfinterruptboundingbox}
\begin{axis}[
title=A title,
xlabel={$x$},
ylabel={$y$},
legend style={at={(0.5,0.97)},
anchor=north,legend columns=-1},
domain=-2:2,
]
\addplot {x^2};
\addplot {x^3};
\addplot {x^4};
\legend{$x^2$,$x^3$,$x^4$}
\end{axis}
\end{pgfinterruptboundingbox}
\useasboundingbox
                                      (current
                    axis.below south west)
                            rectangle
                    (current axis.above north east);
\end{tikzpicture}%
}
The pgfinterruptboundingbox environment does not include its content into the image’s bounding box, and \useasboundingbox sets the pictures bounding box to the following argument (see the PGF/TikZ manual).
-
/tikz/trim left={
 \(x\)-coordinate or point
 }
(default 0pt)
-
/tikz/trim right={
 \(x\)-coordinate or point
 }
}
These two keys allow to reduce the size of the bounding box.
The trim left key expects either a single \(x\)-coordinate like 1cm or a point like (current axis.west). If a point is provided, is uses only the \(x\)-coordinate of that point. Then, the left end of the bounding box is set to the resulting \(x\)-coordinate and everything left of it is outside of the bounding box.
The trim right key has the same effect, only for the right end of the bounding box.
More detailed documentation can be found in the TikZ manual.
-
/tikz/trim axis left(style, no value) 
A style with value trim left=(current axis.south west).
The style needs to be provided as argument to \begin{tikzpicture}[trim axis left]. It expects (at least) one pgfplots environment in the picture. The effect is to trim everything which is left of the last axis’ anchor south west (i.e. everything left of the left axis boundary).
-
/tikz/trim axis right(style, no value) 
A style with value trim right=(current axis.south east).
It works similarly to trim axis left: the effect is that everything right of the right axis line of the last axis environment is truncated from the bounding box.
-
/tikz/trim axis group left(style, no value) 
A style which has the same effect as trim axis left, but is tailored for the groupplots library.
It has the value trim left=(group c1r1.south west).
The style needs to be provided as argument to \begin{tikzpicture}[trim axis group left]. It expects (at least) one groupplot environment in the picture. The effect is to trim everything which is left of the first group axis’ anchor south west (i.e. everything left of the left axis boundary).
-
/tikz/trim axis group right(style, no value) 
A style which has the same effect as trim axis right, but is tailored for the groupplots library.
It works similarly to trim axis group left: the effect is that everything right of the rightmost axis in a group plot (the last element of the groupplot environment) is truncated from the bounding box.
4.20.2Clipping
Clipping influences both the picture size and the visible output in contrast to bounding box restrictions which reduce the picture’s final size while keeping the same graphical output.
Typically, pgfplots uses the path for a boxed axis as clip path. However, clipping has some special features and fine-tuning keys which are explained in this section.
-
/pgfplots/clip=true|false (initially true) 
Controls whether any paths inside of an axis shall be clipped.
This is in effect even if hide axis=true.
Note that a clip path can contribute to the picture’s bounding box. Starting with compat=1.8, pgfplots applies intelligence to separate the responsibilities clipping and bounding box control, see clip bounding box and its choices. As of compat=1.8, a clip path can be in effect although the bounding box is considerably smaller than the clip path. This is typically what one expects if the clip path is invisible.
The clip path is generated using \pgfplotspathaxisoutline, i.e. it is the path induced by boxed axis lines. For a three-dimensional plot, only the outer axis lines are used. A plot with centered axis lines uses the outer axis lines as well.
-
/pgfplots/clip marker paths=true|false (initially false) 
The initial choice clip marker paths=false causes markers to be drawn after the clipped region. Only their positions will be clipped.
As a consequence, markers will be drawn completely, or not at all. The value clip marker paths=true is here for backwards compatibility: it does not introduce special marker treatment, so markers may be drawn partially if they are close to the clipping boundary.66
This key has no effect if clip=false.
Note that clip marker paths also affects the sequence in which plots and their markers are drawn on top of each other. See also the related key clip mode.
-
/pgfplots/clip bounding box=default tikz|upper bound (initially controlled by compat key) 
Controls how the path generated by clip=true contributes to the bounding box. This has a consequence for axis lines\(\neq \)box, in particular, for hide axis: if the value is default tikz, hiding (parts of) the axis will not reduce the bounding box because the clip path is as large as before. The value upper bound allows to reduce the bounding box also in case of hide axis.
More precisely, the choice default tikz installs the clip path induced by the axis as ordinary TikZ path (see \pgfplotspathaxisoutline). That means its bounding box essentially contributes to the picture’s bounding box, irrespective of the size of contained paths.
The choice upper bound allows to reduce the picture’s bounding box to what is actually shown: if the picture only contains graphical elements which are completely within the bounding box of \pgfplotspathaxisoutline, the bounding box is made up of those contained elements. If the contained elements are actually larger than the bounding box of \pgfplotspathaxisoutline, they are clipped to the outline’s path (“upper bound”). The latter case ensures that parts of the graphics which are excluded by clip are not counted for the bounding box.
Keep in mind that hide axis is independent of clip=true: the clip path might still be in effect even though the axis outline is invisible.
This key is irrelevant if clip=false. In addition, it has no effect for axis lines=box since the box path is made up from \pgfplotspathaxisoutline. It has an effect for hide axis=true or for choices of axis lines in which parts of the axis are empty.
This key is controlled by the compat level. Its default is default tikz. Since compat=1.8, it is set to upper bound.
The key has no effect if clip=false.
-
/pgfplots/clip mode=global|individual (initially global) 
-
1. the resulting PDF will be slightly larger due to the repeated paths,
-
2. custom drawing instruction like \node or \draw need to be clipped manually: use
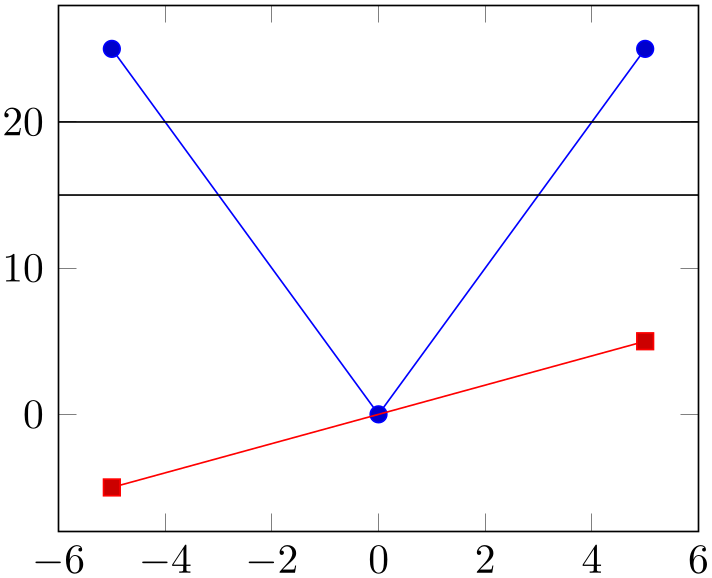
% Preamble: \pgfplotsset{width=7cm,compat=1.18}\begin{tikzpicture}\begin{axis}[clip mode=individual,]\addplot+ [samples=3] {x^2};\begin{scope}\clip \pgfextra{\pgfplotspathaxisoutline};\draw (-20,15) -- (20,15);\draw (-20,20) -- (20,20);\end{scope}\addplot+ [samples=2] {x};\end{axis}\end{tikzpicture}to install a custom clip path around your \draw instructions for such a use case. Here, the path instruction \pgfplotspathaxisoutline results in a path of the axis outline, i.e. the path which is used for the background paths or for clipping. Since it is a basic level macro, it needs to be encapsulated by \pgfextra.
This key controls how pgfplots implements the clip=true feature (which is on by default). Its primary motivation is control where markers are placed: are markers on top of everything else (choice global) or are they overdrawn by following plots (choice individual)?
The choice global tells pgfplots to install one single clip path for the complete picture.67 In order to avoid clipped marker paths, any markers are processed after the clip path has been closed, i.e. on a separate layer (see clip marker paths). An unexpected side effect is that marks are on top of plots, even if the plots have been added after the markers.
The choice individual instructs pgfplots to install a separate clip path for every \addplot command. Consequently, the plot will be clipped. But most importantly, its markers will be drawn immediately after the clip path has been deactivated.
An unexpected side effect of clip mode=individual is that
Note that clip marker paths can lead to the same result as clip mode=individual if the plot does not reach the boundaries.